Figure 8. The pathway analyses generated from bulk RNA-seq and scRNA-seq data demonstrate significant changes in energy metabolism (purple
frame), protein synthesis (yellow frame), oxidative stress/apoptosis/autophagy (green frame), and proliferation/transcription
regulation (blue frame) related pathways. A: A violin plot shows the rod photoreceptor cells from the scRNA-seq data after splitting into high vs. medium vs. low expression
of Bicdl1, and the total number of cells in each category. Expression levels for Bicdl1 were defined as: Bicdl1-lo (expression >0 and <1.5), Bicdl1-med (expression 1.5-2.5), and Bicdl1-hi (expression >2.5). B: Top 25 pathways from scRNA-seq p90 rod photoreceptors comparing low vs. high expression of Bicdl1 (Bicdl1-lo vs. Bicdl1-hi). C: A volcano plot shows expression levels of selected genes from bulk RNA-seq data. Green dots: genes with decreased level
of expression, red dots: genes with increased level of expression. D: Top 25 pathways from bulk RNA-seq of retina samples from 9-week-old Bicdl1 WT and KI mice comparing Bicdl1 KI versus WT. Bicdl1 WT, n = 4 pooled retinal samples; KI, n = 4 pooled retinal samples, with each pooled sample consisting of retinas from three
individual mice. *: shared pathways between the scRNA-seq and bulk RNA-seq analysis.
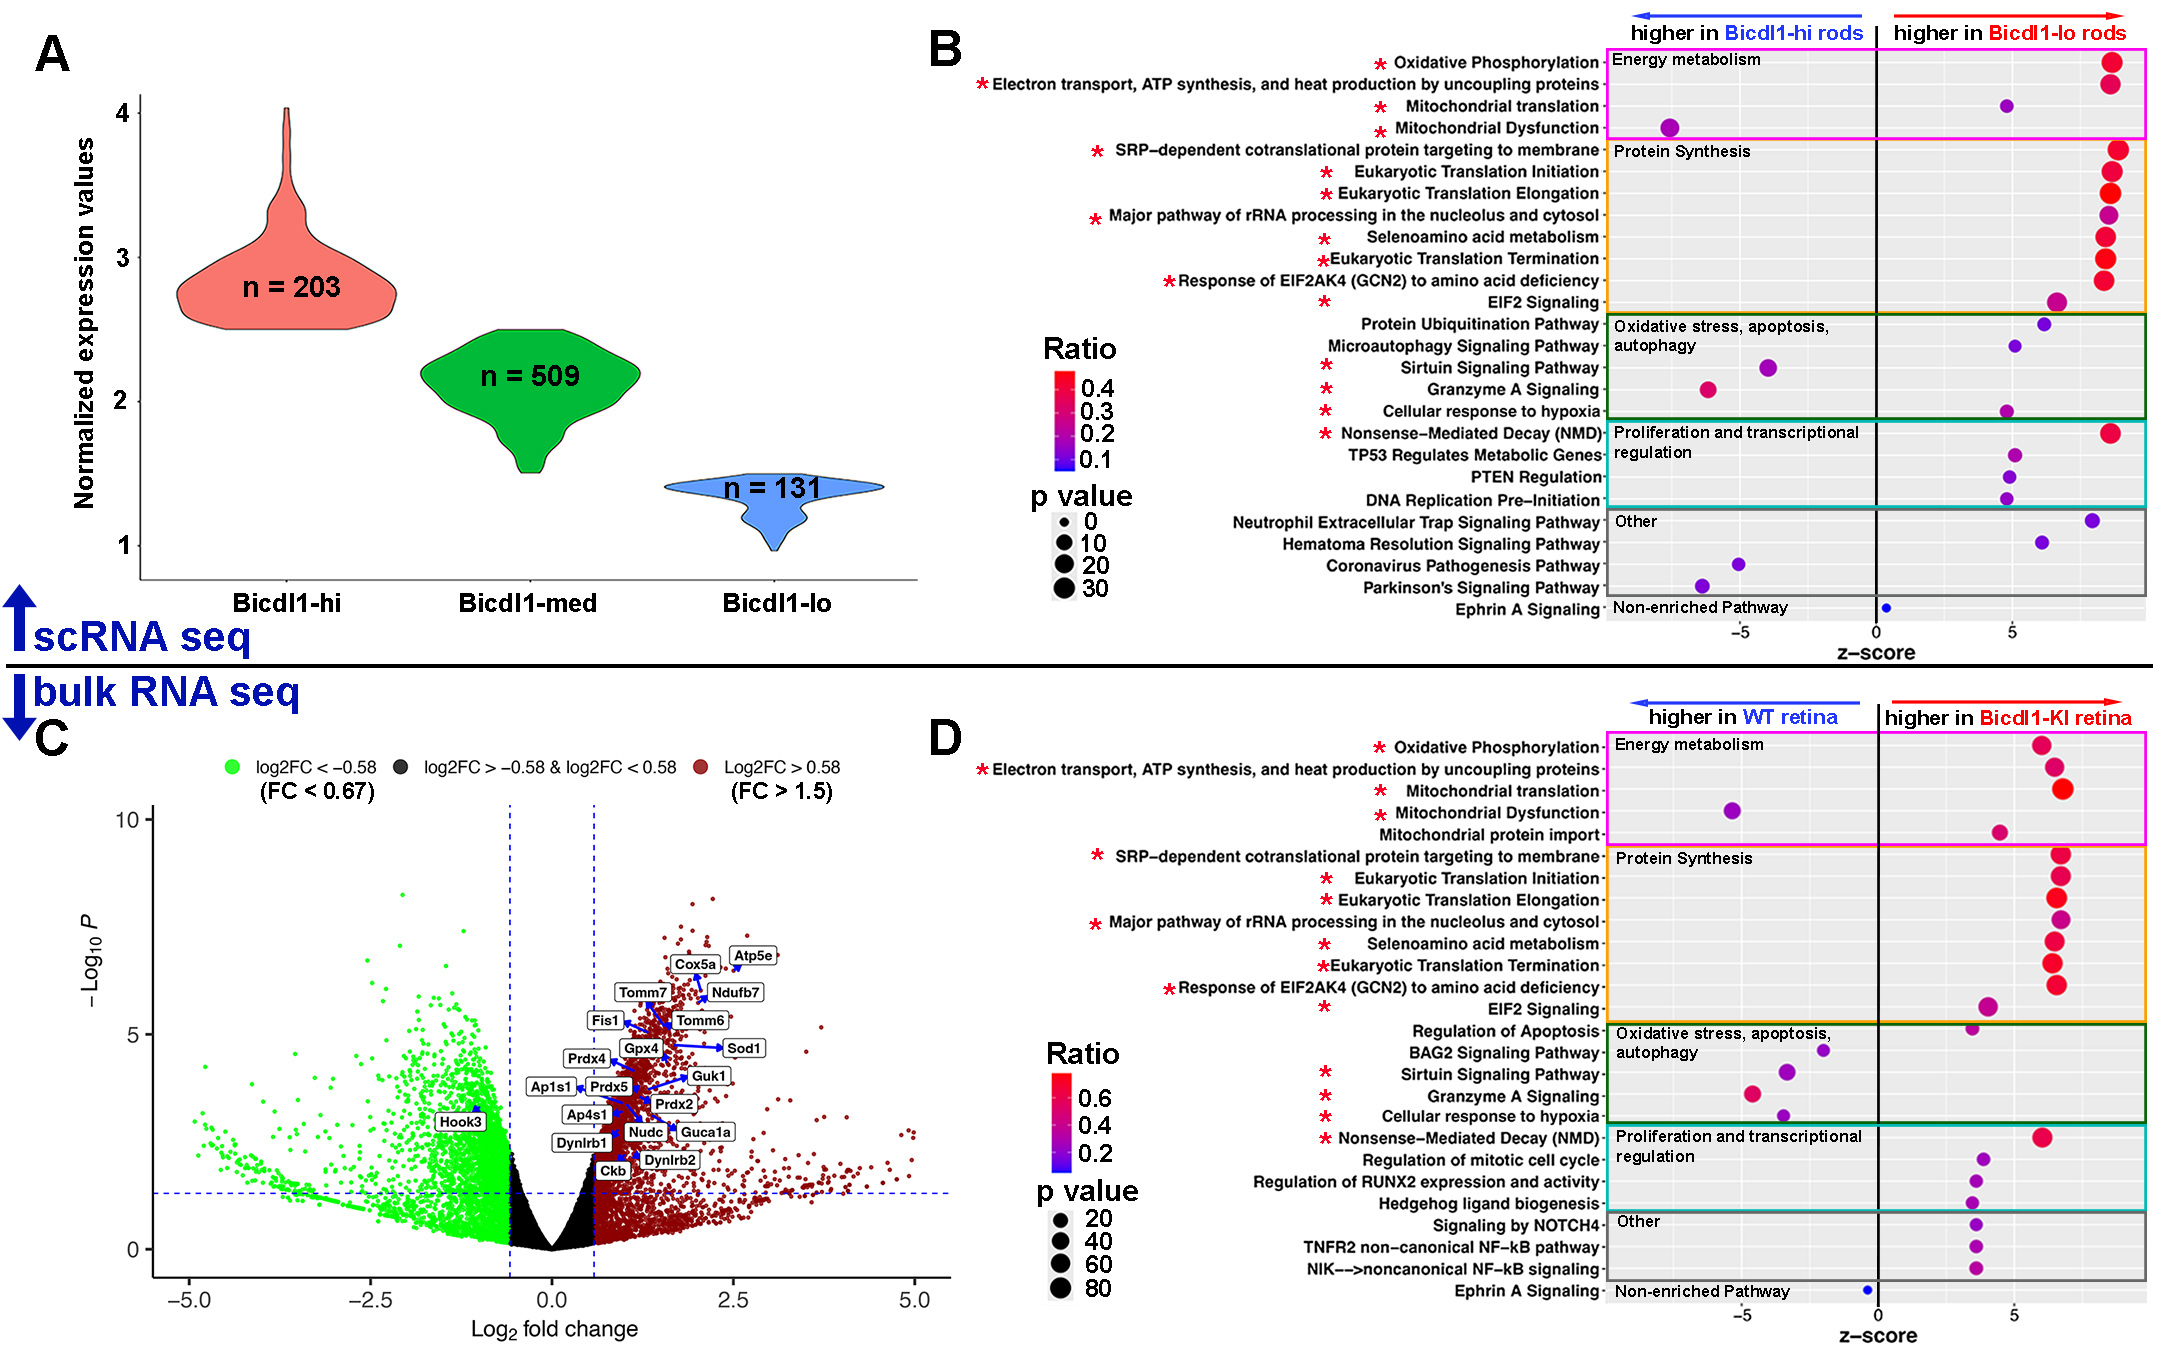
 Figure 8 of
Ulker-Yilmazer, Mol Vis 2026; 32:281-306.
Figure 8 of
Ulker-Yilmazer, Mol Vis 2026; 32:281-306.