Figure 7. Bicdl1 KI mice have decreased a-wave amplitude at 17-19 months of age. A: Representative ERG tracings of 17-19-month-old Bicdl1 WT and KI mice are shown. B, C: Normalized a-wave (B, flash intensities 0.01, 0.1 and 1 cd⋅s/m2) and b-wave amplitudes (C, flash intensities 0.01, 0.1, and 1 cd⋅s/m2) from individual mice at 12 m (WT n = 6, KI n = 5), 15 m (WT n = 9, KI n = 10), and 17-19 m (WT n = 15, KI n = 19) are shown.
A decreased a-wave is seen in aging Bicdl1 KI mice (B). No significant difference was detected in b-wave (C). Black squares: WT mice, blue squares: Bicdl1 KI mice, green filled squares: male, open squares: female. Data are shown as means ± SEM. ns: non-significant, #: p < 0.1,
*: p < 0.05, **: p < 0.01.
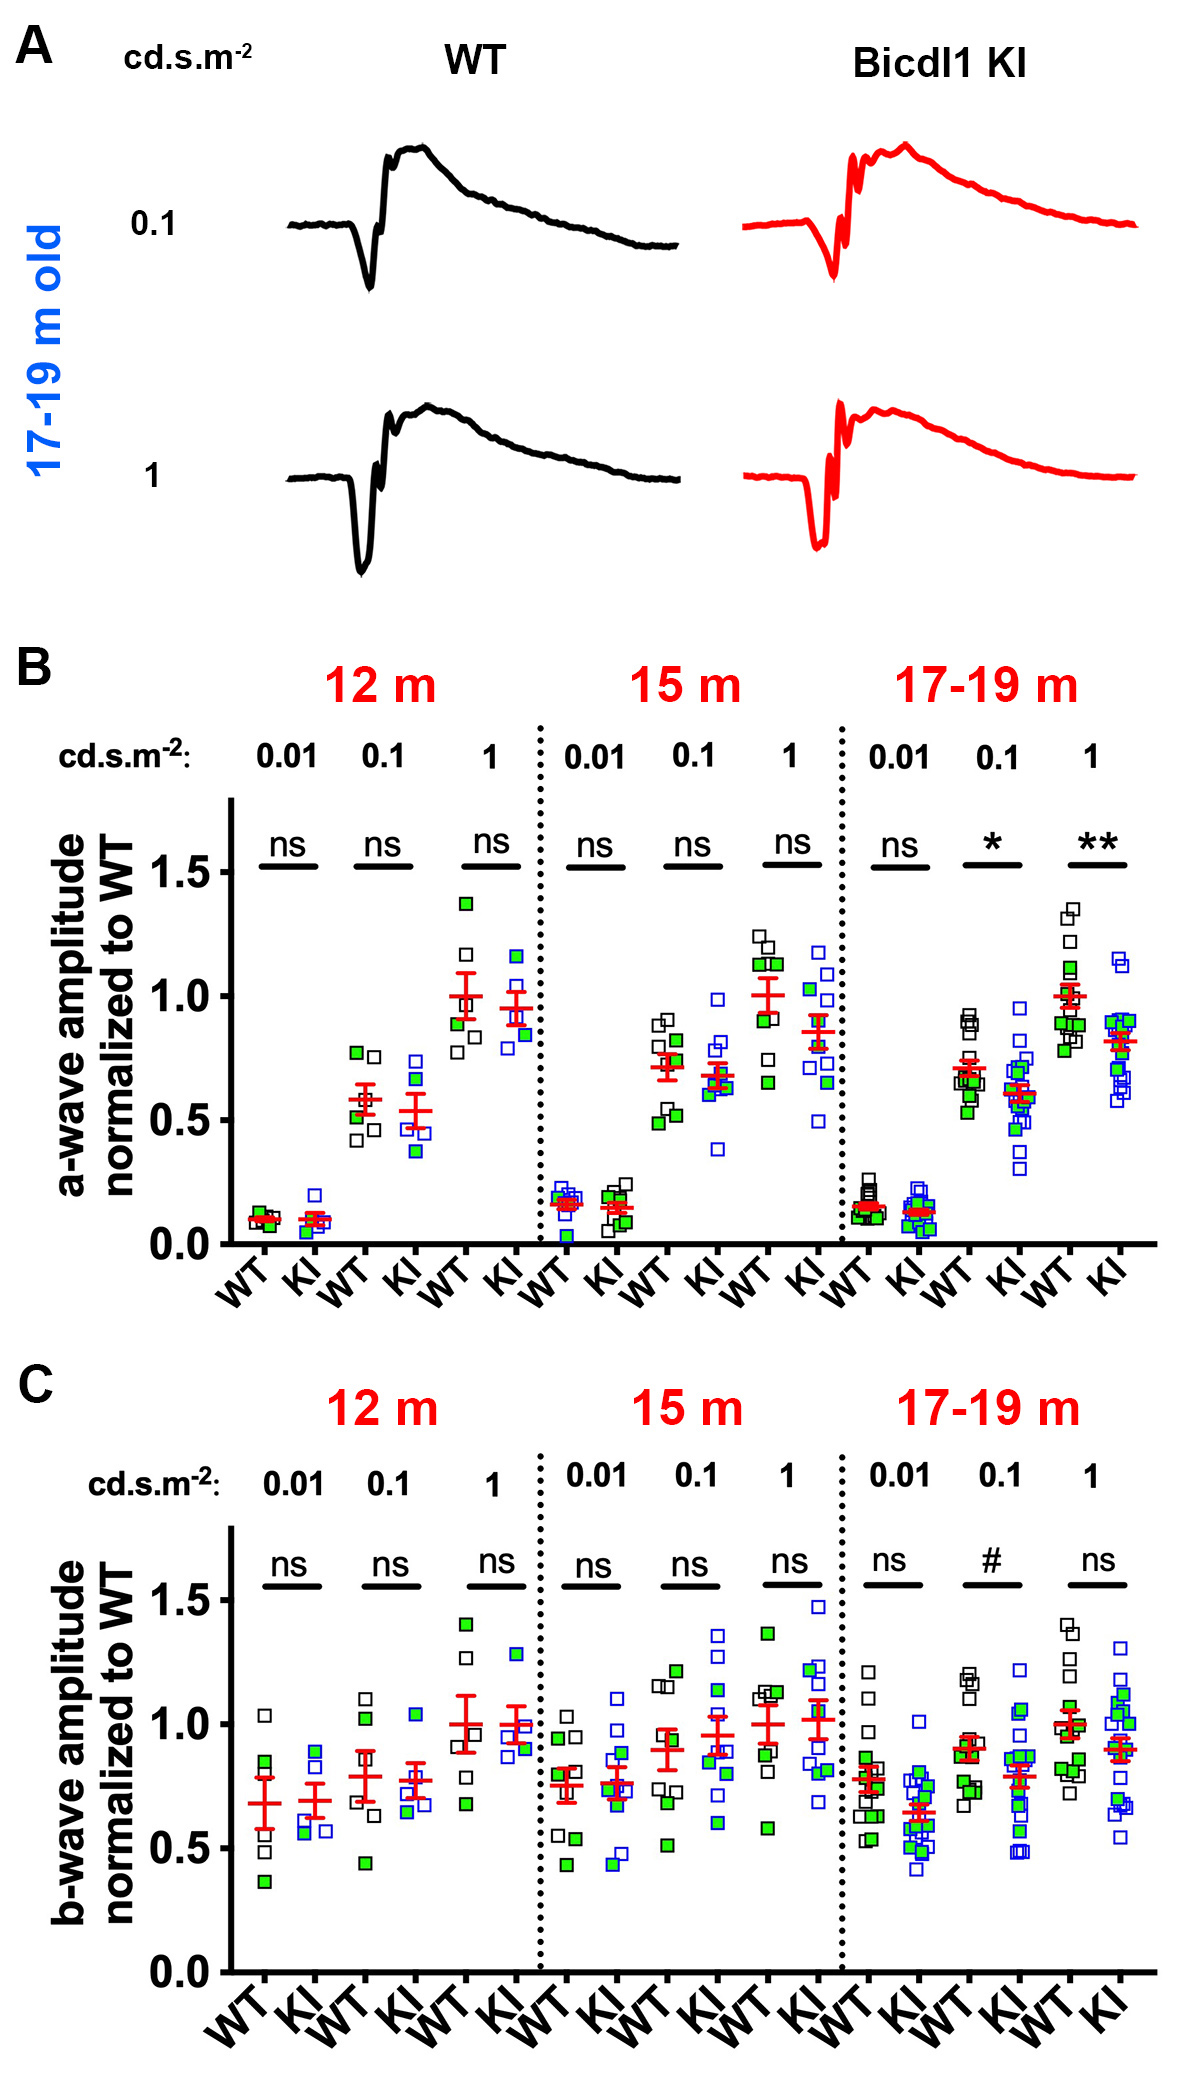
 Figure 7 of
Ulker-Yilmazer, Mol Vis 2026; 32:281-306.
Figure 7 of
Ulker-Yilmazer, Mol Vis 2026; 32:281-306.