Figure 6. Subretinal microglia number is significantly increased in Bicdl1 KI mice. A-C: Fundus spots appear to correspond to subretinal microglia. A: Fundus photo of mouse retina with a very asymmetric distribution of fundus spots. The majority of fundus spots are localized
to a small area of the inferior retina (red oval). B: An RPE flat mount of the same eye demonstrates a similar distribution (red oval) of Iba1+ microglia overlying the RPE. The orange, irregular dotted line highlights the cut on the posterior flat mount where the optic
disc used to be. C: A magnified view of the yellow square in panel B shows Iba1+ cells with the typical morphology of both ramified and ameboid microglia. Some microglia lack cell bodies (red
arrows), likely due to artifactual separation during flat-mount preparation. D, E: Representative RPE flat mounts images from 9-month-old WT and Bicdl1 KI mice acquired with a 25× objective (NA 1.0) at the paracentral (D) and midperipheral (E) regions. Green cells are Iba1+ microglia, red cells are Tmem119+ microglia. F, G: Quantitative analysis shows increased subretinal Iba1+ cells and Tmem119+ cells in the paracentral region (F, G; WT, n = 6 eyes, KI, n = 6 eyes) in Bicdl1 KI samples compared with WT samples. Measurements represent the average of all four quadrants per eye (F, G). PC: paracentral region (four quadrants); MP: midperipheral region (four quadrants). Black diamonds: WT mice, blue diamonds:
Bicdl1 KI mice, Data are shown as means ± SEM. ns: non-significant, *: p < 0.05, scale bar: 100 µm.
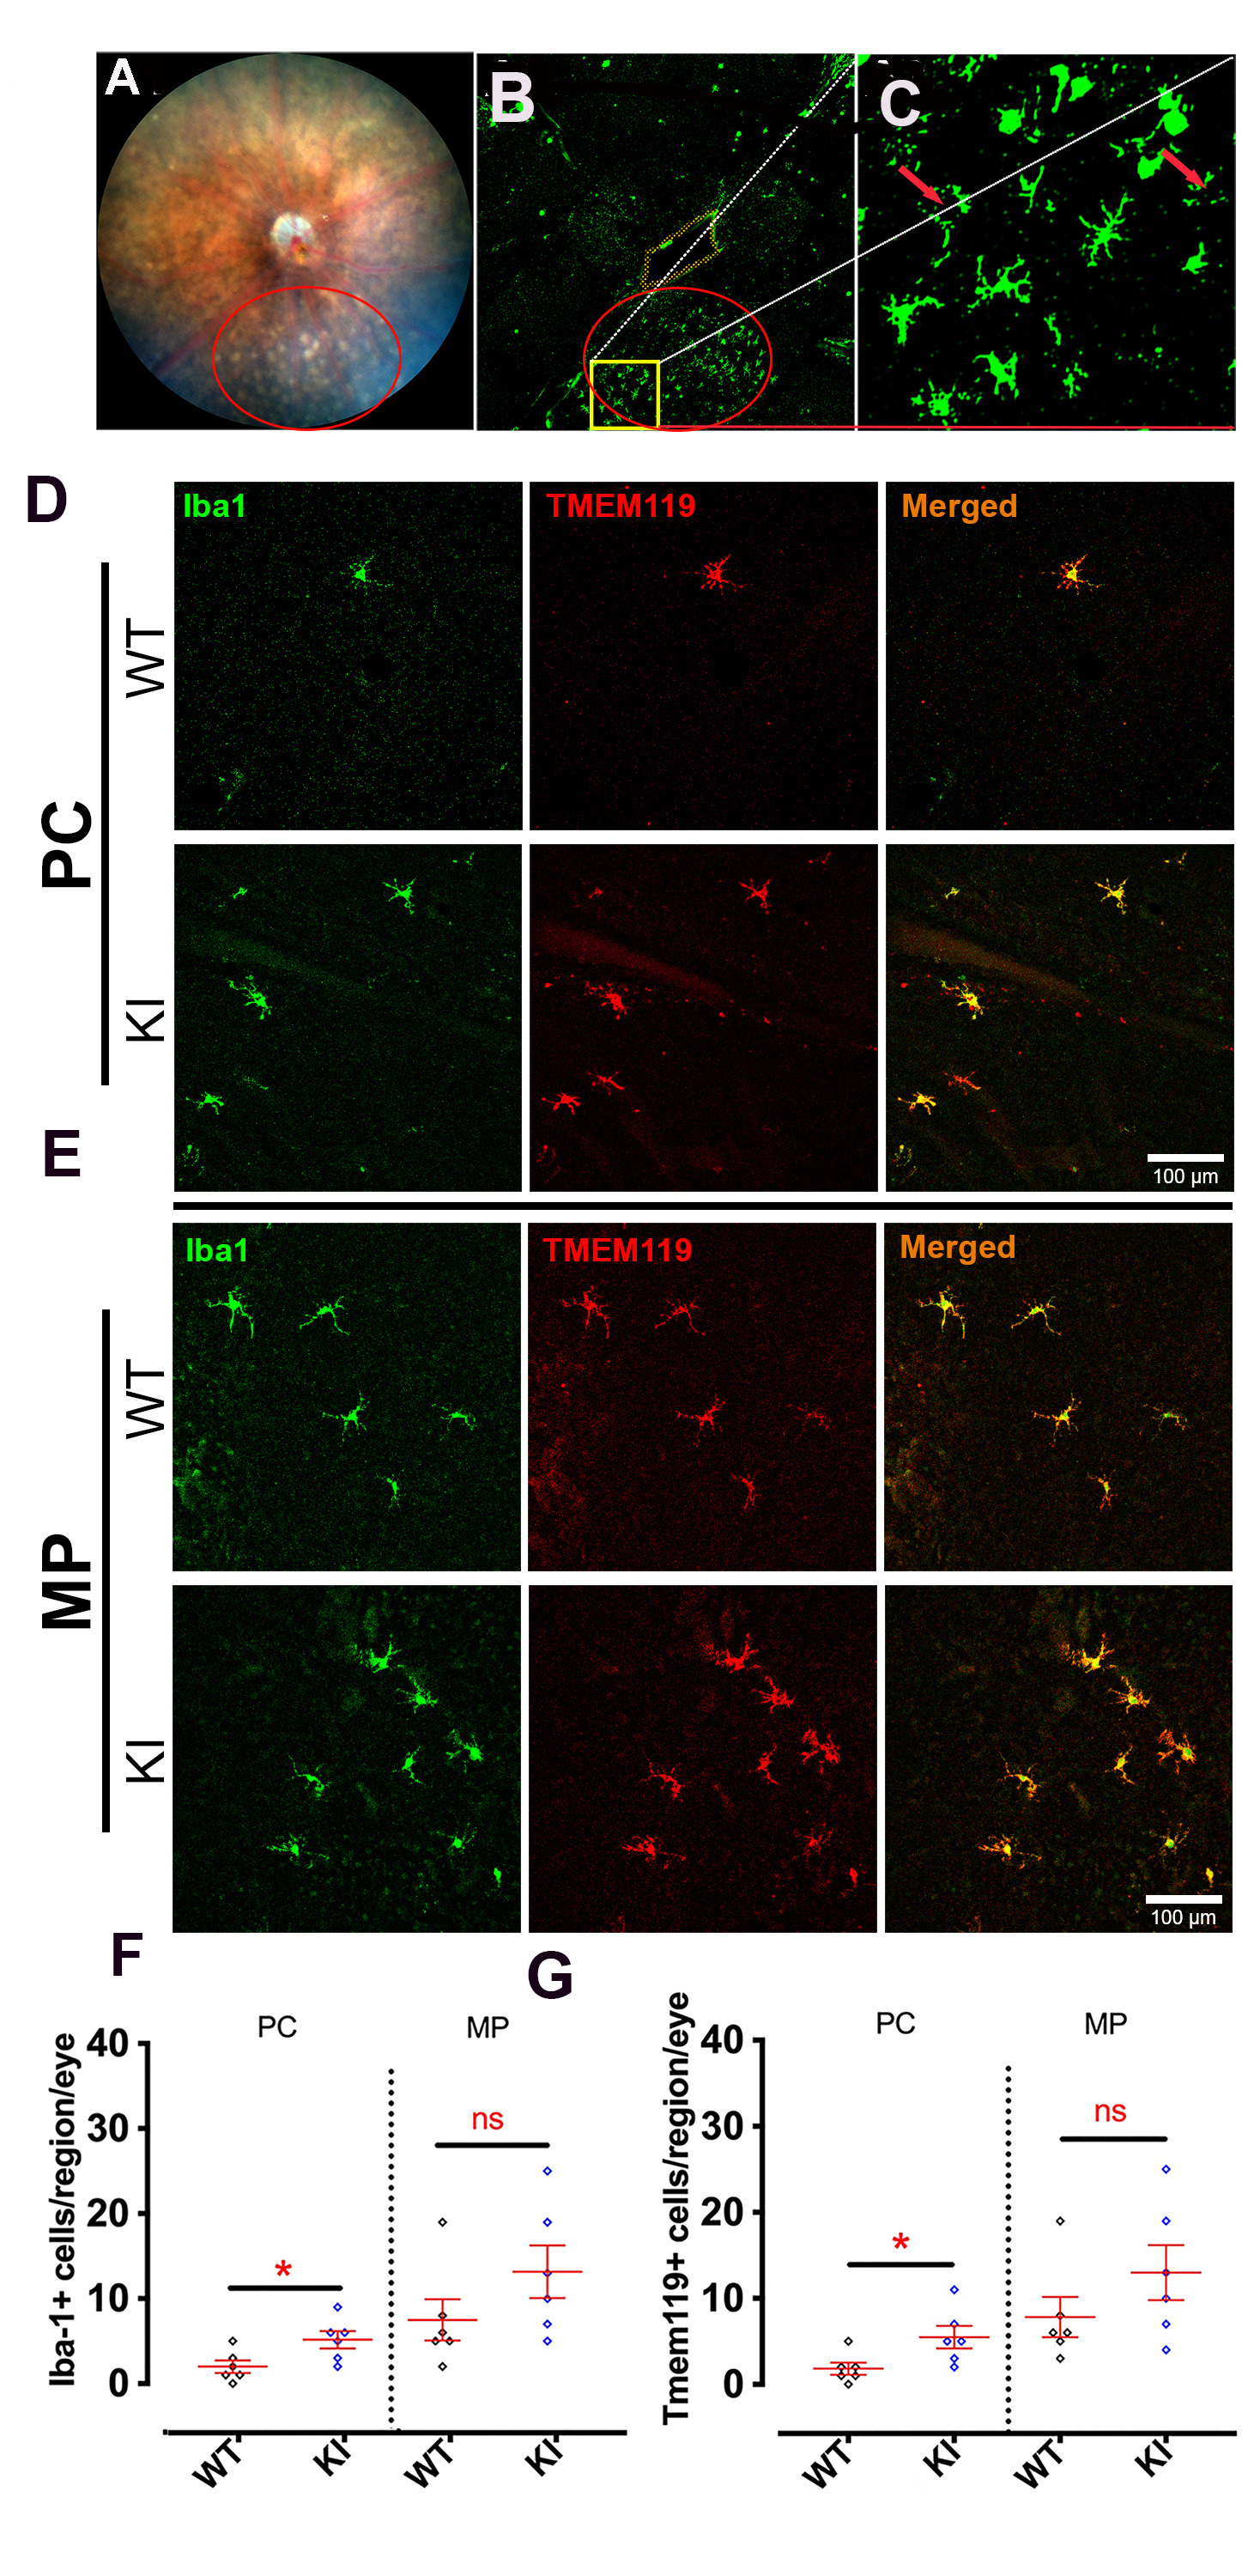
 Figure 6 of
Ulker-Yilmazer, Mol Vis 2026; 32:281-306.
Figure 6 of
Ulker-Yilmazer, Mol Vis 2026; 32:281-306.