Figure 5. Bicdl1 KI mice demonstrate an increased number of fundus spots compared to WT mice. A-J: Representative fundus images of WT and Bicdl1 KI mice at 2, 4, 6, 9, and 15 months of age. K: Fundus spot grade per mouse at different age groups. There is a significant increase in the number of fundus spots in the
Bicdl1 KI mice at all time points after 2 months of age (2 m, WT n = 16, KI n = 20; 4 m, WT n = 15, KI n = 17; 6 m, WT n = 10, KI
n = 14; 9 m, WT n = 10, KI n = 9; 15 m, WT n = 8, KI n = 8). The values represent the sum of the grading for the left and
right eyes of each mouse. Black squares: WT mice, blue squares: Bicdl1 KI mice, green filled square: male, open square: female. Data are shown as means ± SEM. ns: non-significant, *: p < 0.05,
**: p < 0.01.
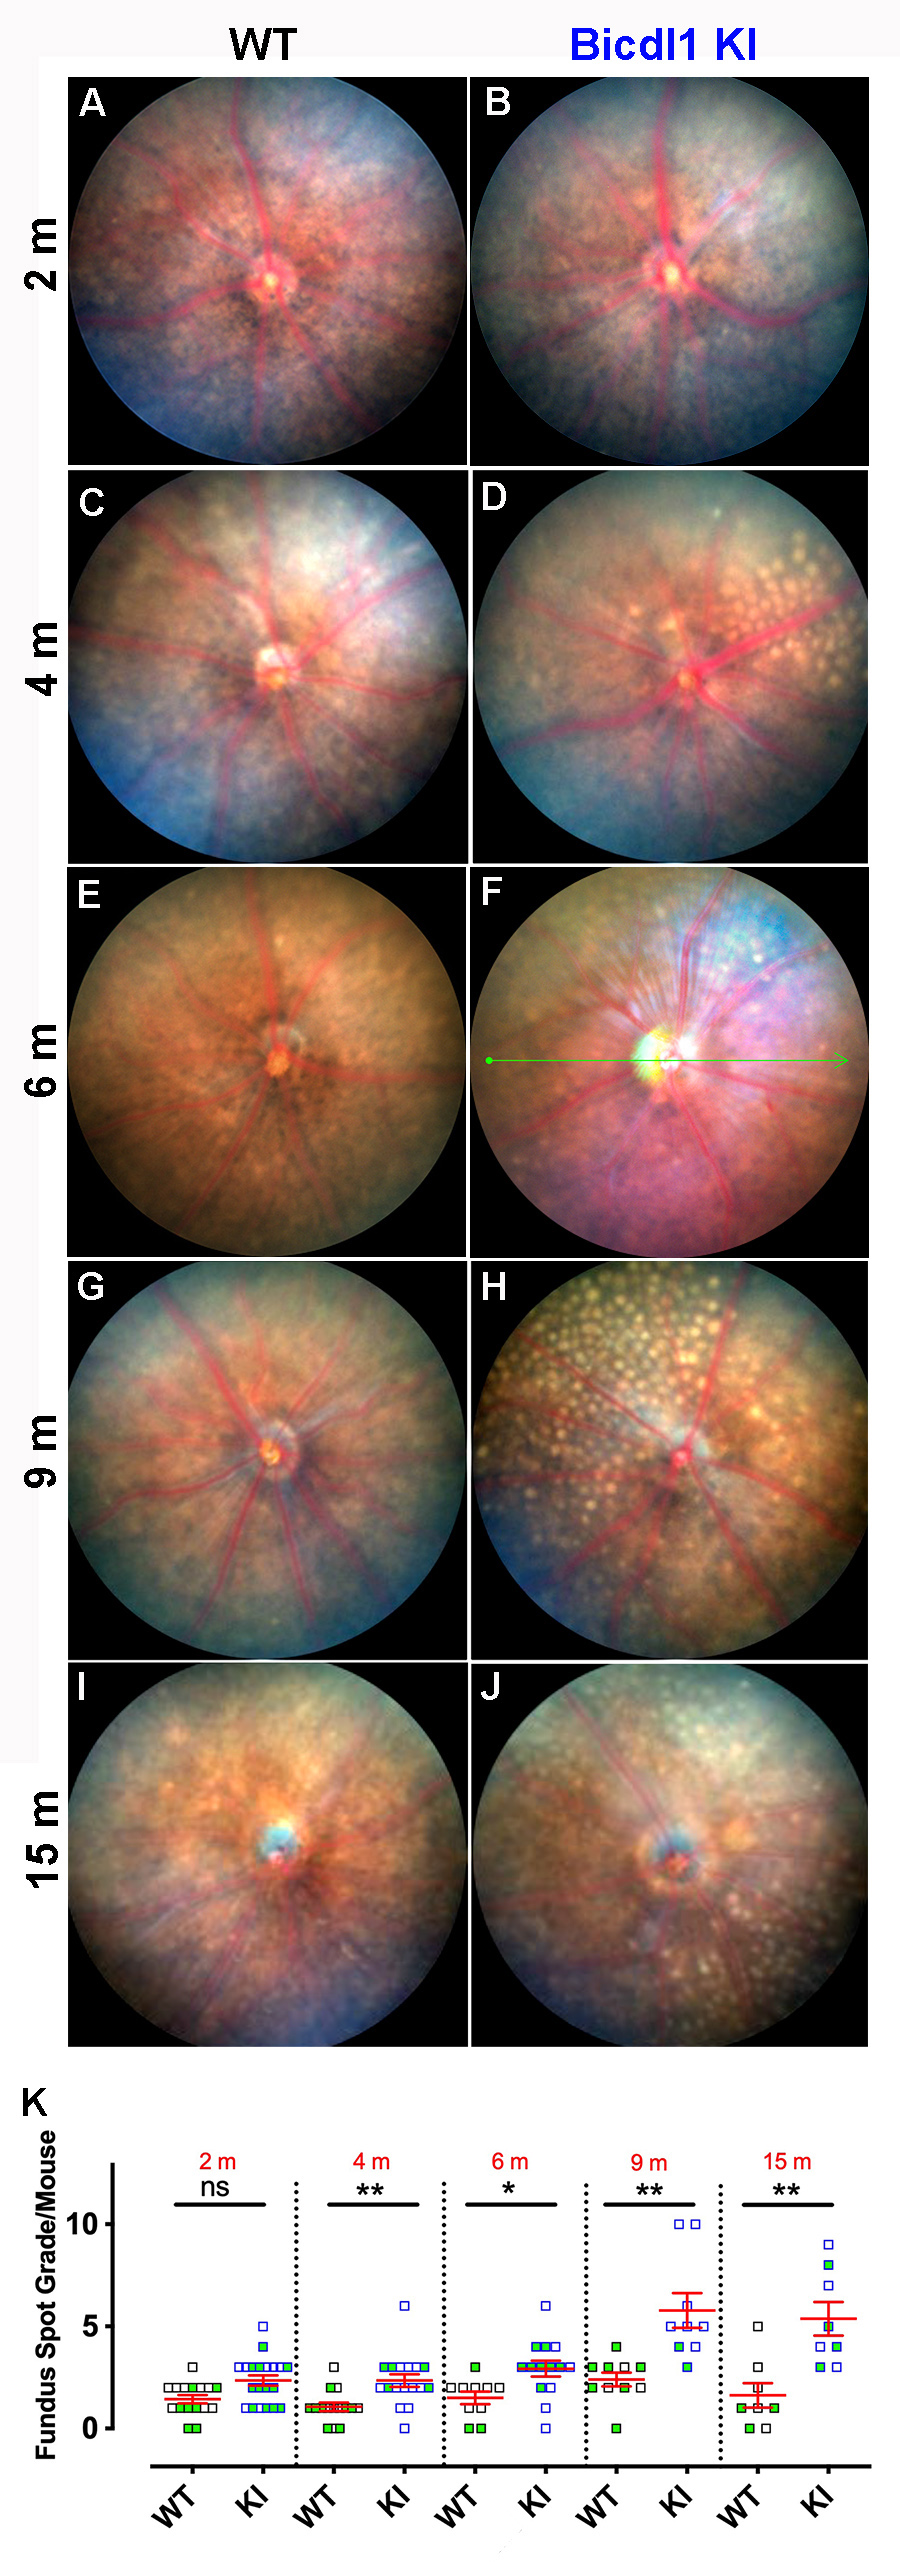
 Figure 5 of
Ulker-Yilmazer, Mol Vis 2026; 32:281-306.
Figure 5 of
Ulker-Yilmazer, Mol Vis 2026; 32:281-306.