Appendix 16 of
Ulker-Yilmazer, Mol Vis 2026; 32:281-306.
Appendix 16 of
Ulker-Yilmazer, Mol Vis 2026; 32:281-306. Appendix 16 of
Ulker-Yilmazer, Mol Vis 2026; 32:281-306.
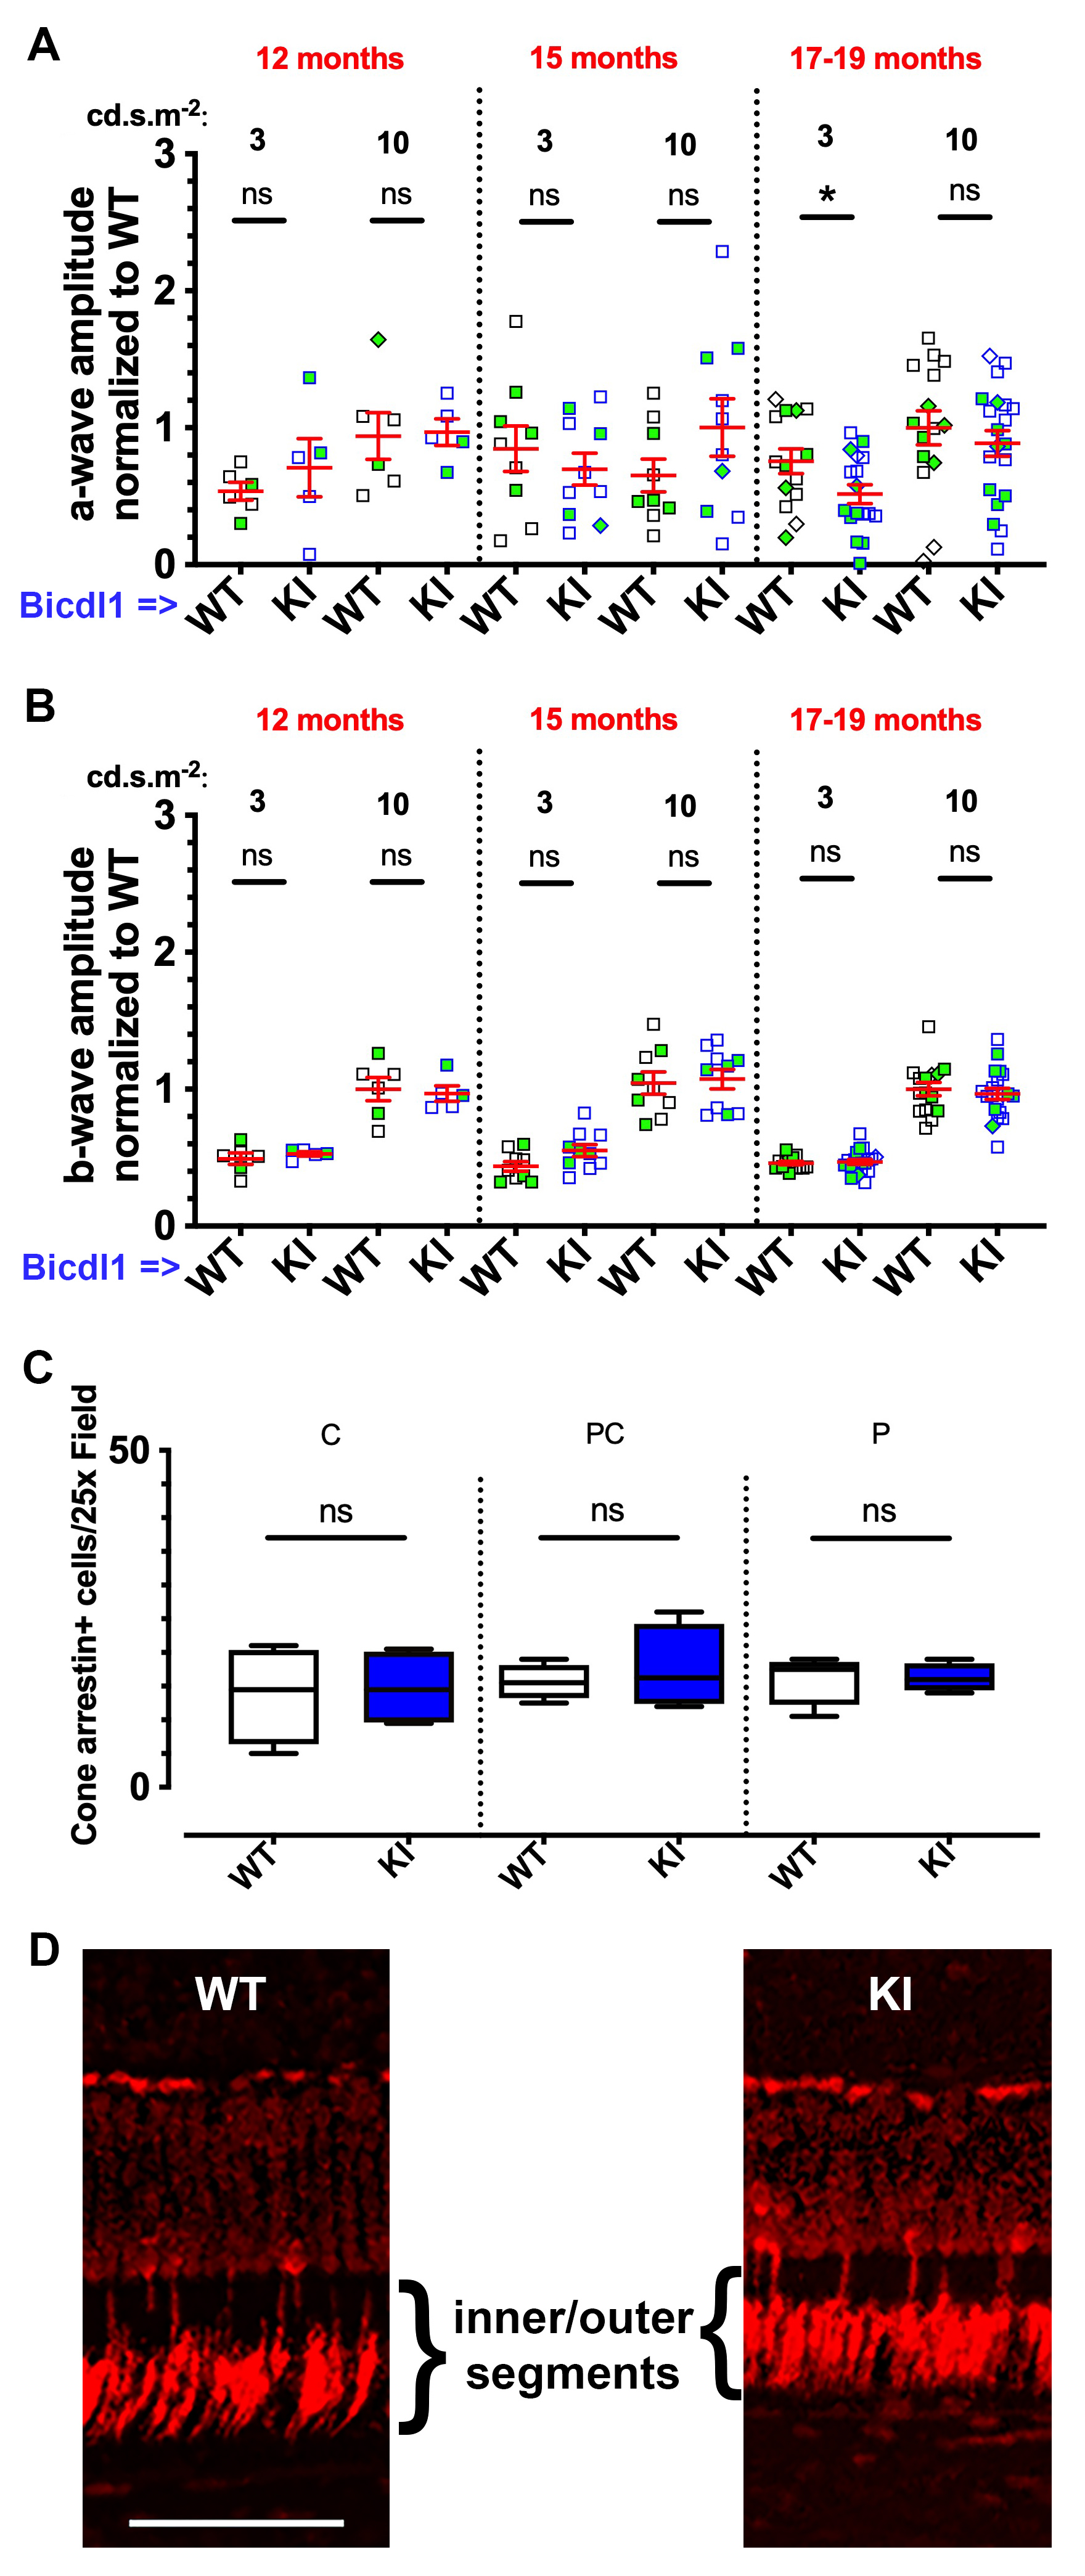
Appendix 16. Supplementary Figure S13: Photopic ERG responses and cone arrestin staining are not altered in Bicdl1 KI mice.
To access the data, click or select the words “Appendix 16.” A, B) Normalized a-wave (A) and b-wave (B) amplitudes at flash intensities of 3 and 10 cd⋅s/m2 were measured in individual mice under light-adapted conditions at 12 m (WT n = 6, KI n = 5), 15 m (WT n = 9, KI n = 10), and 17-19 m (WT n = 15, KI n = 19). C) Cone arrestin+ cells were counted in the central, paracentral, and peripheral regions of the retina in both Bicdl1 KI mice and WT mice at 19 m (WT n = 5, KI n = 5). No consistent differences in photopic ERG responses or number of cone arrestin-stained cells were observed between WT and KI mice. D) Representative cone arrestin-stained cells are shown for WT and KI mice with inner/outer segments marked. Scale bar in panel D = 50 μm. Black squares: WT mice, blue squares: Bicdl1 KI mice, green filled squares: male, open squares: female. ns: non-significant, *: p < 0.05.