Figure 5. Measurement of intraocular (IOP) pressure in a mouse model of acute high-IOP glaucoma. A. Construction of a mouse model of acute high-IOP glaucoma presented. B. Measurement of intraocular pressure in mice after perfusion in each group. IOP values are expressed as the mean ± standard
deviation of each time point. After 15 min of perfusion, the IOP of the mice increased significantly at each time point. In
the perfused 15-min, 30-min, 1-h, 3-day, and 7-day groups, the IOP of mice pretreated with different concentrations of SS31
and AICAR was lower than that of the perfused group. Data are from three independent experiments. *Significantly different
from the preperfusion group, p < 0.05. n = 6.
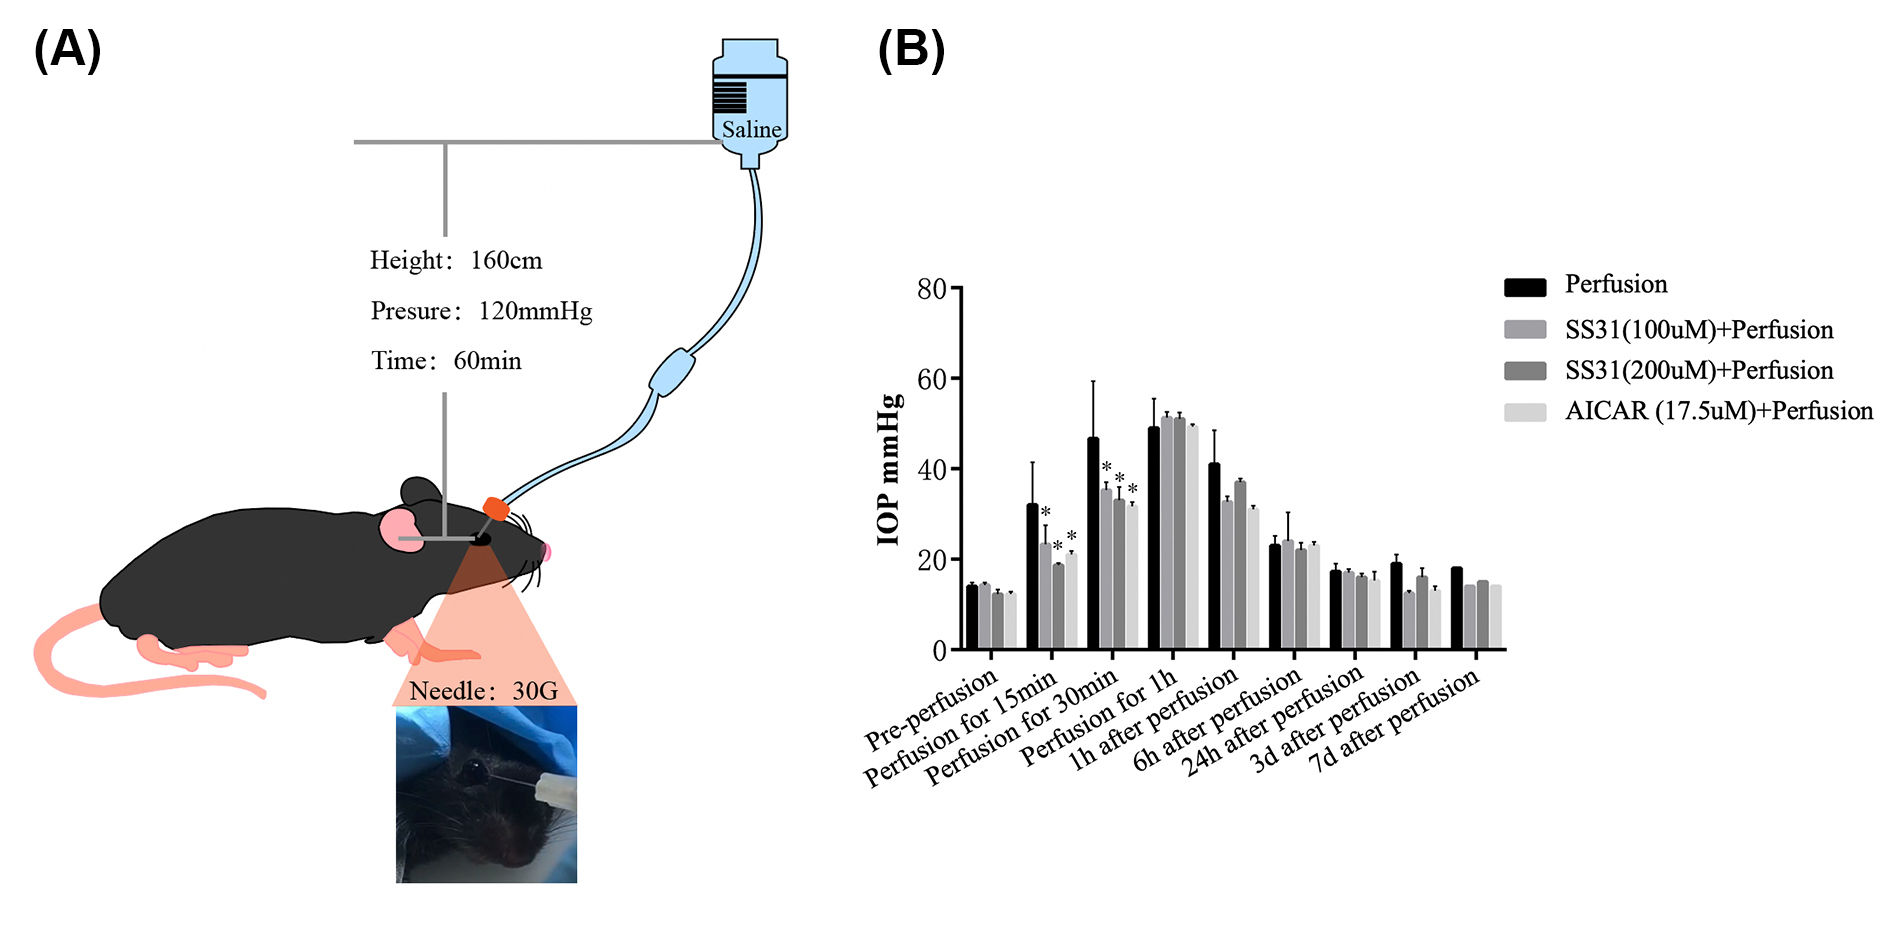
 Figure 5 of
Cui, Mol Vis 2026; 32:265-279.
Figure 5 of
Cui, Mol Vis 2026; 32:265-279.