Figure 2. Effect of SS31 on H2O2-induced 661W cell death via the AMPK signaling pathway. A. Morphological map of 661W cells under a phase-contrast microscope shown. Scale bar: 50 μm. B. Cell viability assay by the MTT assay. *Significantly different from H2O2, p < 0.05. #Significantly different from S+H, p < 0.01. n = 35. C. LDH assay. *Significantly different from H2O2, p < 0.05. #Significantly different from S+H, p < 0.01. n = 6. A, AICAR; D, dorsomorphin; H, H2O2.
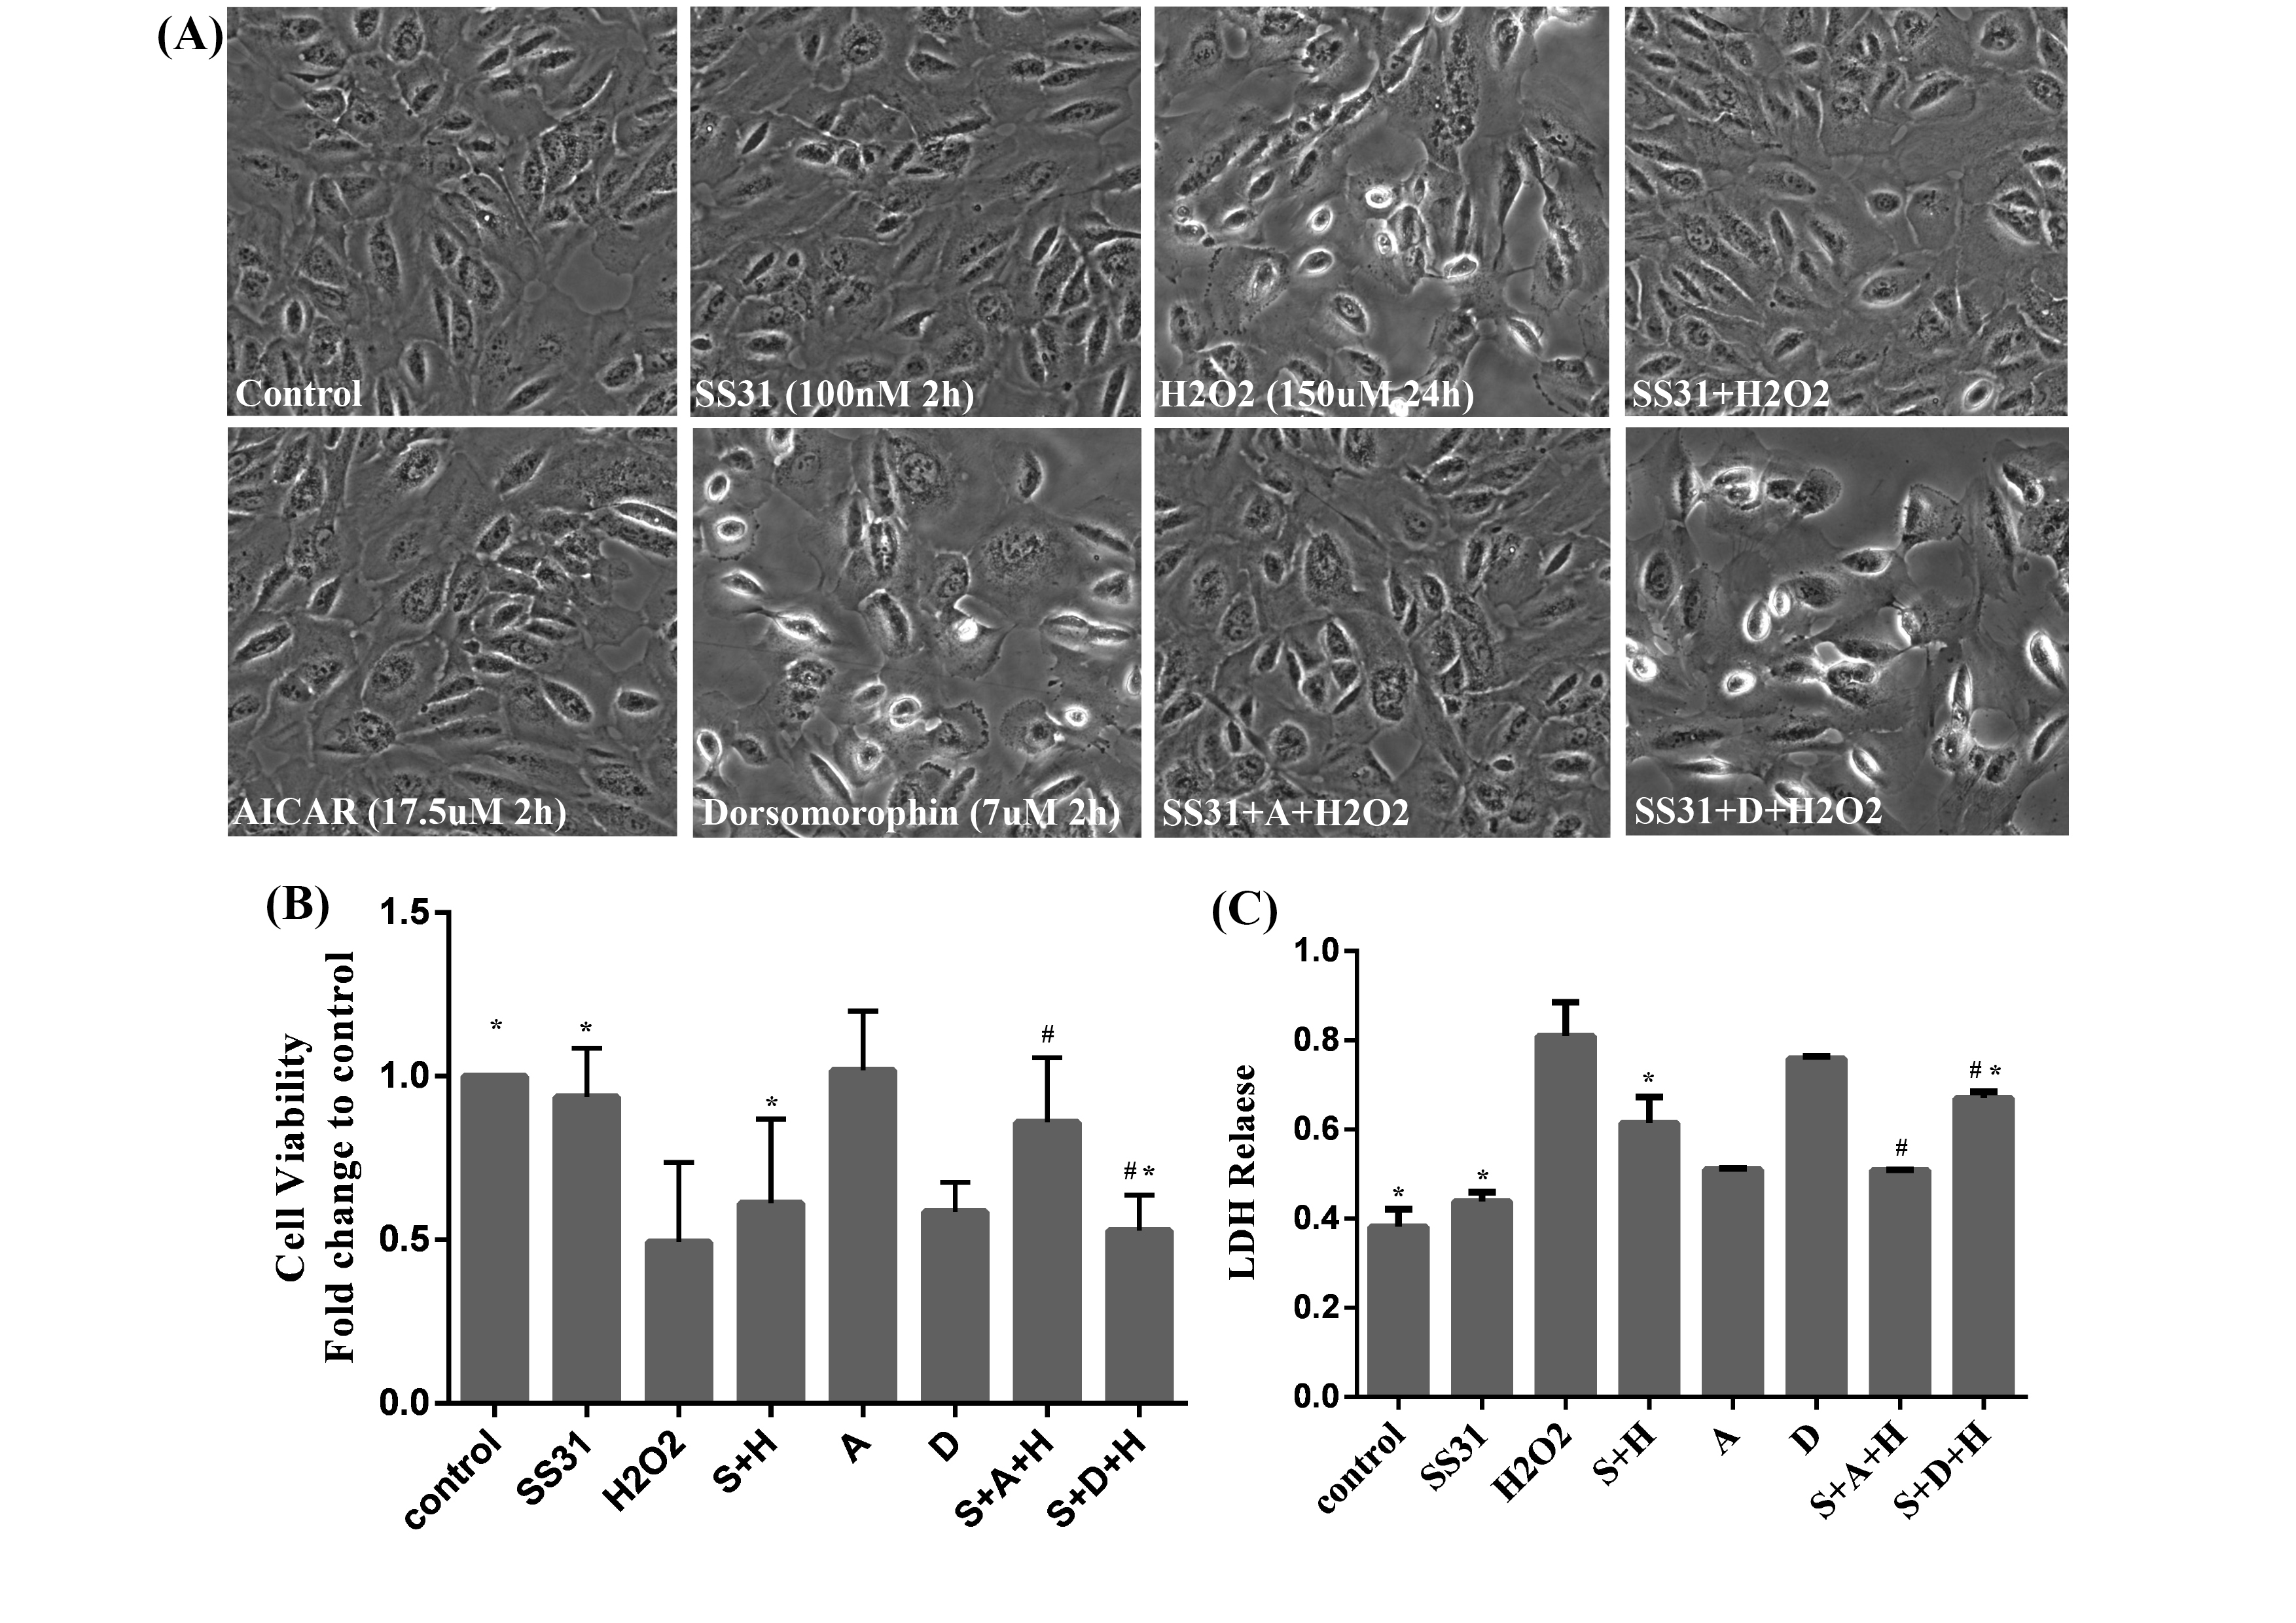
 Figure 2 of
Cui, Mol Vis 2026; 32:265-279.
Figure 2 of
Cui, Mol Vis 2026; 32:265-279.