Figure 1. Real-time dynamic live-cell imaging cell confluence and growth curves of 661W cells. 661W-makte2 cells were passaged for model
injury and drug administration according to the experimental protocol, placed in a 37 °C incubator for 10 min, and then put
into a real-time dynamic live-cell imaging system to monitor the changes in cell proliferation (n = 6). Real-time dynamic
live-cell imaging was used to record the growth and proliferation curves of 661W cells in the normal group, H2O2 treatment group, and SS31 treatment group. A. The green curve represents the normal control group, the yellow curve represents the oxidative damage group, the dark blue
curve represents the SS31 monotherapy group, and the red curve represents the SS31 combined with H2O2 treatment group. B. The green curve represents the normal control group, the yellow and cyan curves represent the oxidative damage group, the
rose red and gray curves represent the SS31 monotherapy group, and the purple, red, and yellow-green curves represent the
SS31 combined with the H2O2 treatment group.
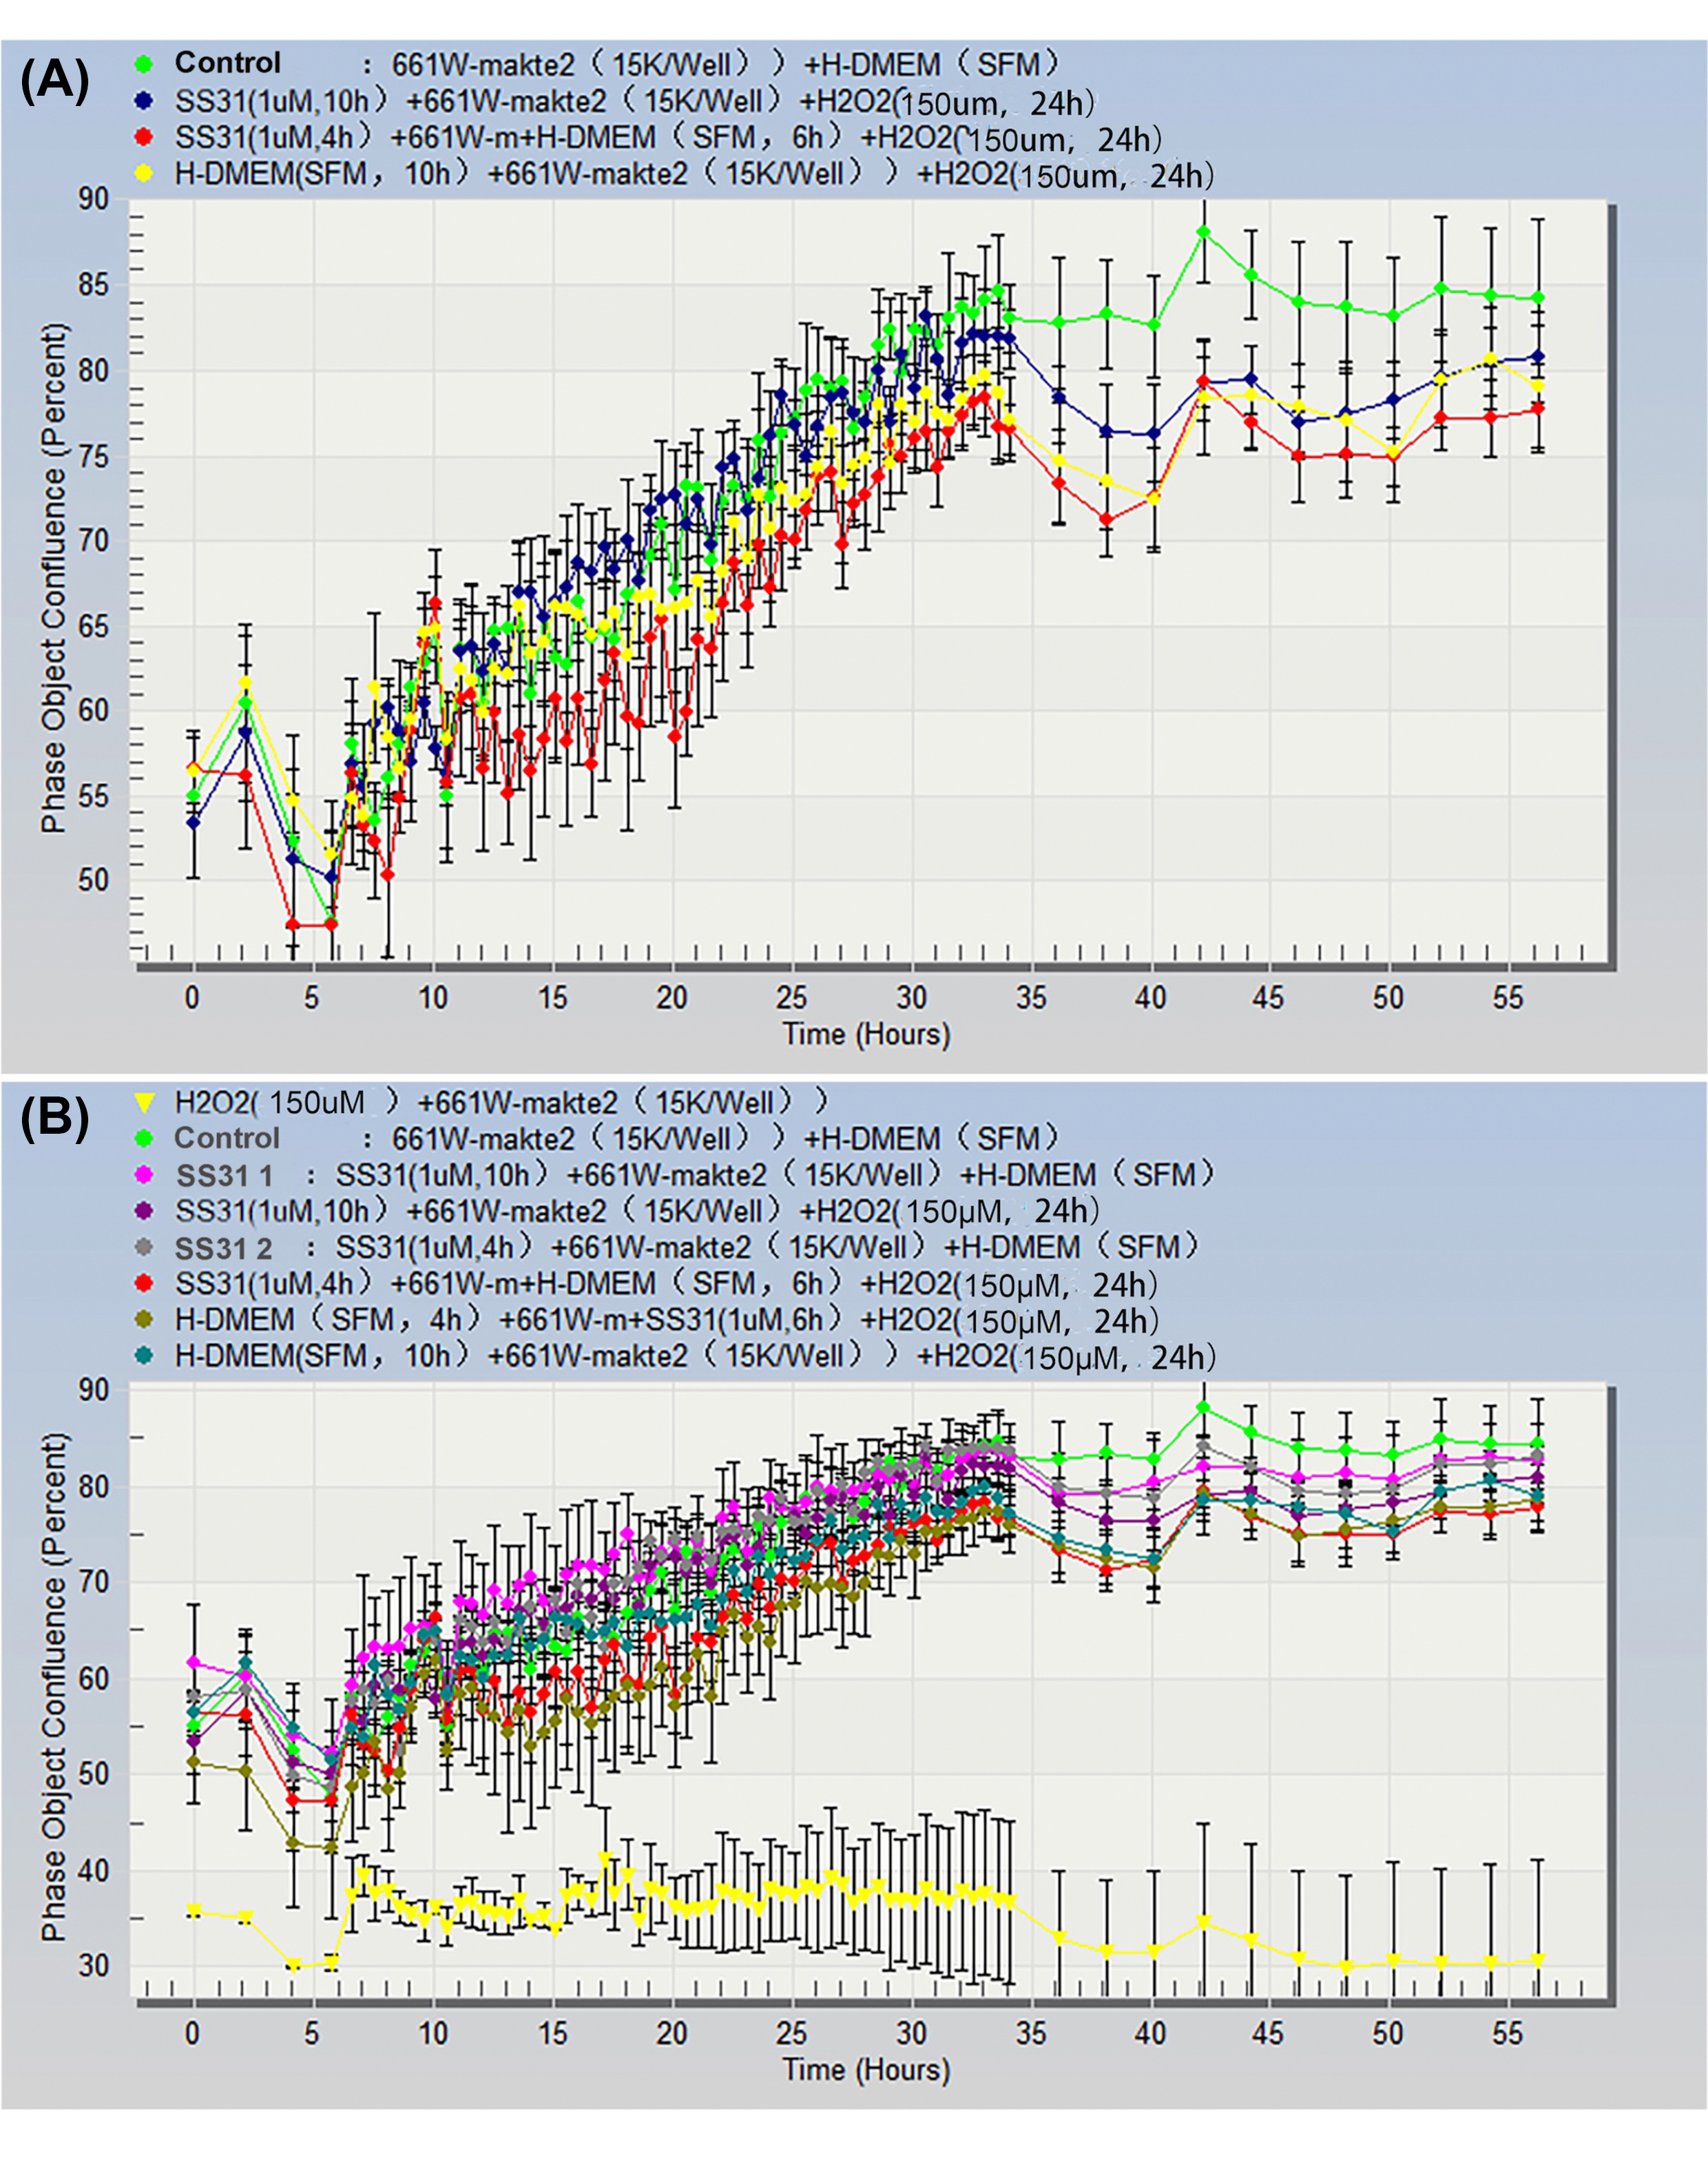
 Figure 1 of
Cui, Mol Vis 2026; 32:265-279.
Figure 1 of
Cui, Mol Vis 2026; 32:265-279.