Appendix 2 of
Cui, Mol Vis 2026; 32:265-279.
Appendix 2 of
Cui, Mol Vis 2026; 32:265-279. Appendix 2 of
Cui, Mol Vis 2026; 32:265-279.
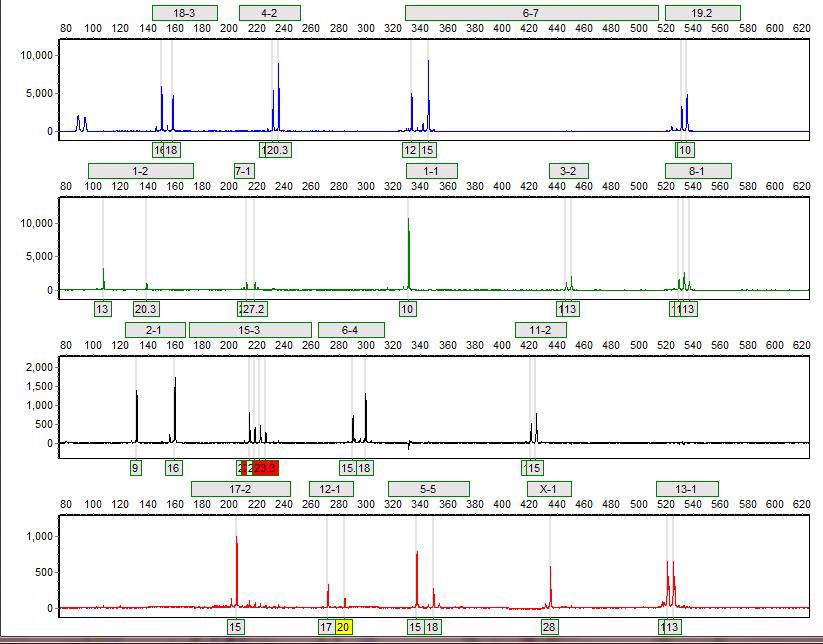
Appendix 2. STR profiles of 661W cell line.
To access the data, click or select the words “Appendix 2.” The four curves correspond to STR loci labeled with four different fluorescent markers (blue=FAM, green=VIC, black=NED, red=PET). The abscissa (x-axis) represents the length of DNA fragments (unit: bp), reflecting the length of STR repeat sequences. The ordinate (y-axis) represents the intensity of fluorescent signals, indicating the amount of amplification products.