Figure 4. Retinal histopathological analysis. A: Control group showing normal retinal architecture with distinct layers: GCL (ganglion cell layer), IPL (inner plexiform
layer), INL (inner nuclear layer), ONL (outer nuclear layer); (B) EIU group exhibiting marked hyperemia (solid arrow) and edema with noticeable thickening of the inner plexiform layer (dashed
arrow); (C) EIU+FVX group with attenuated pathological changes; (D) FVX group showing largely normal retinal architecture. HE staining. Scale bars=50 μm. *p<0.01.
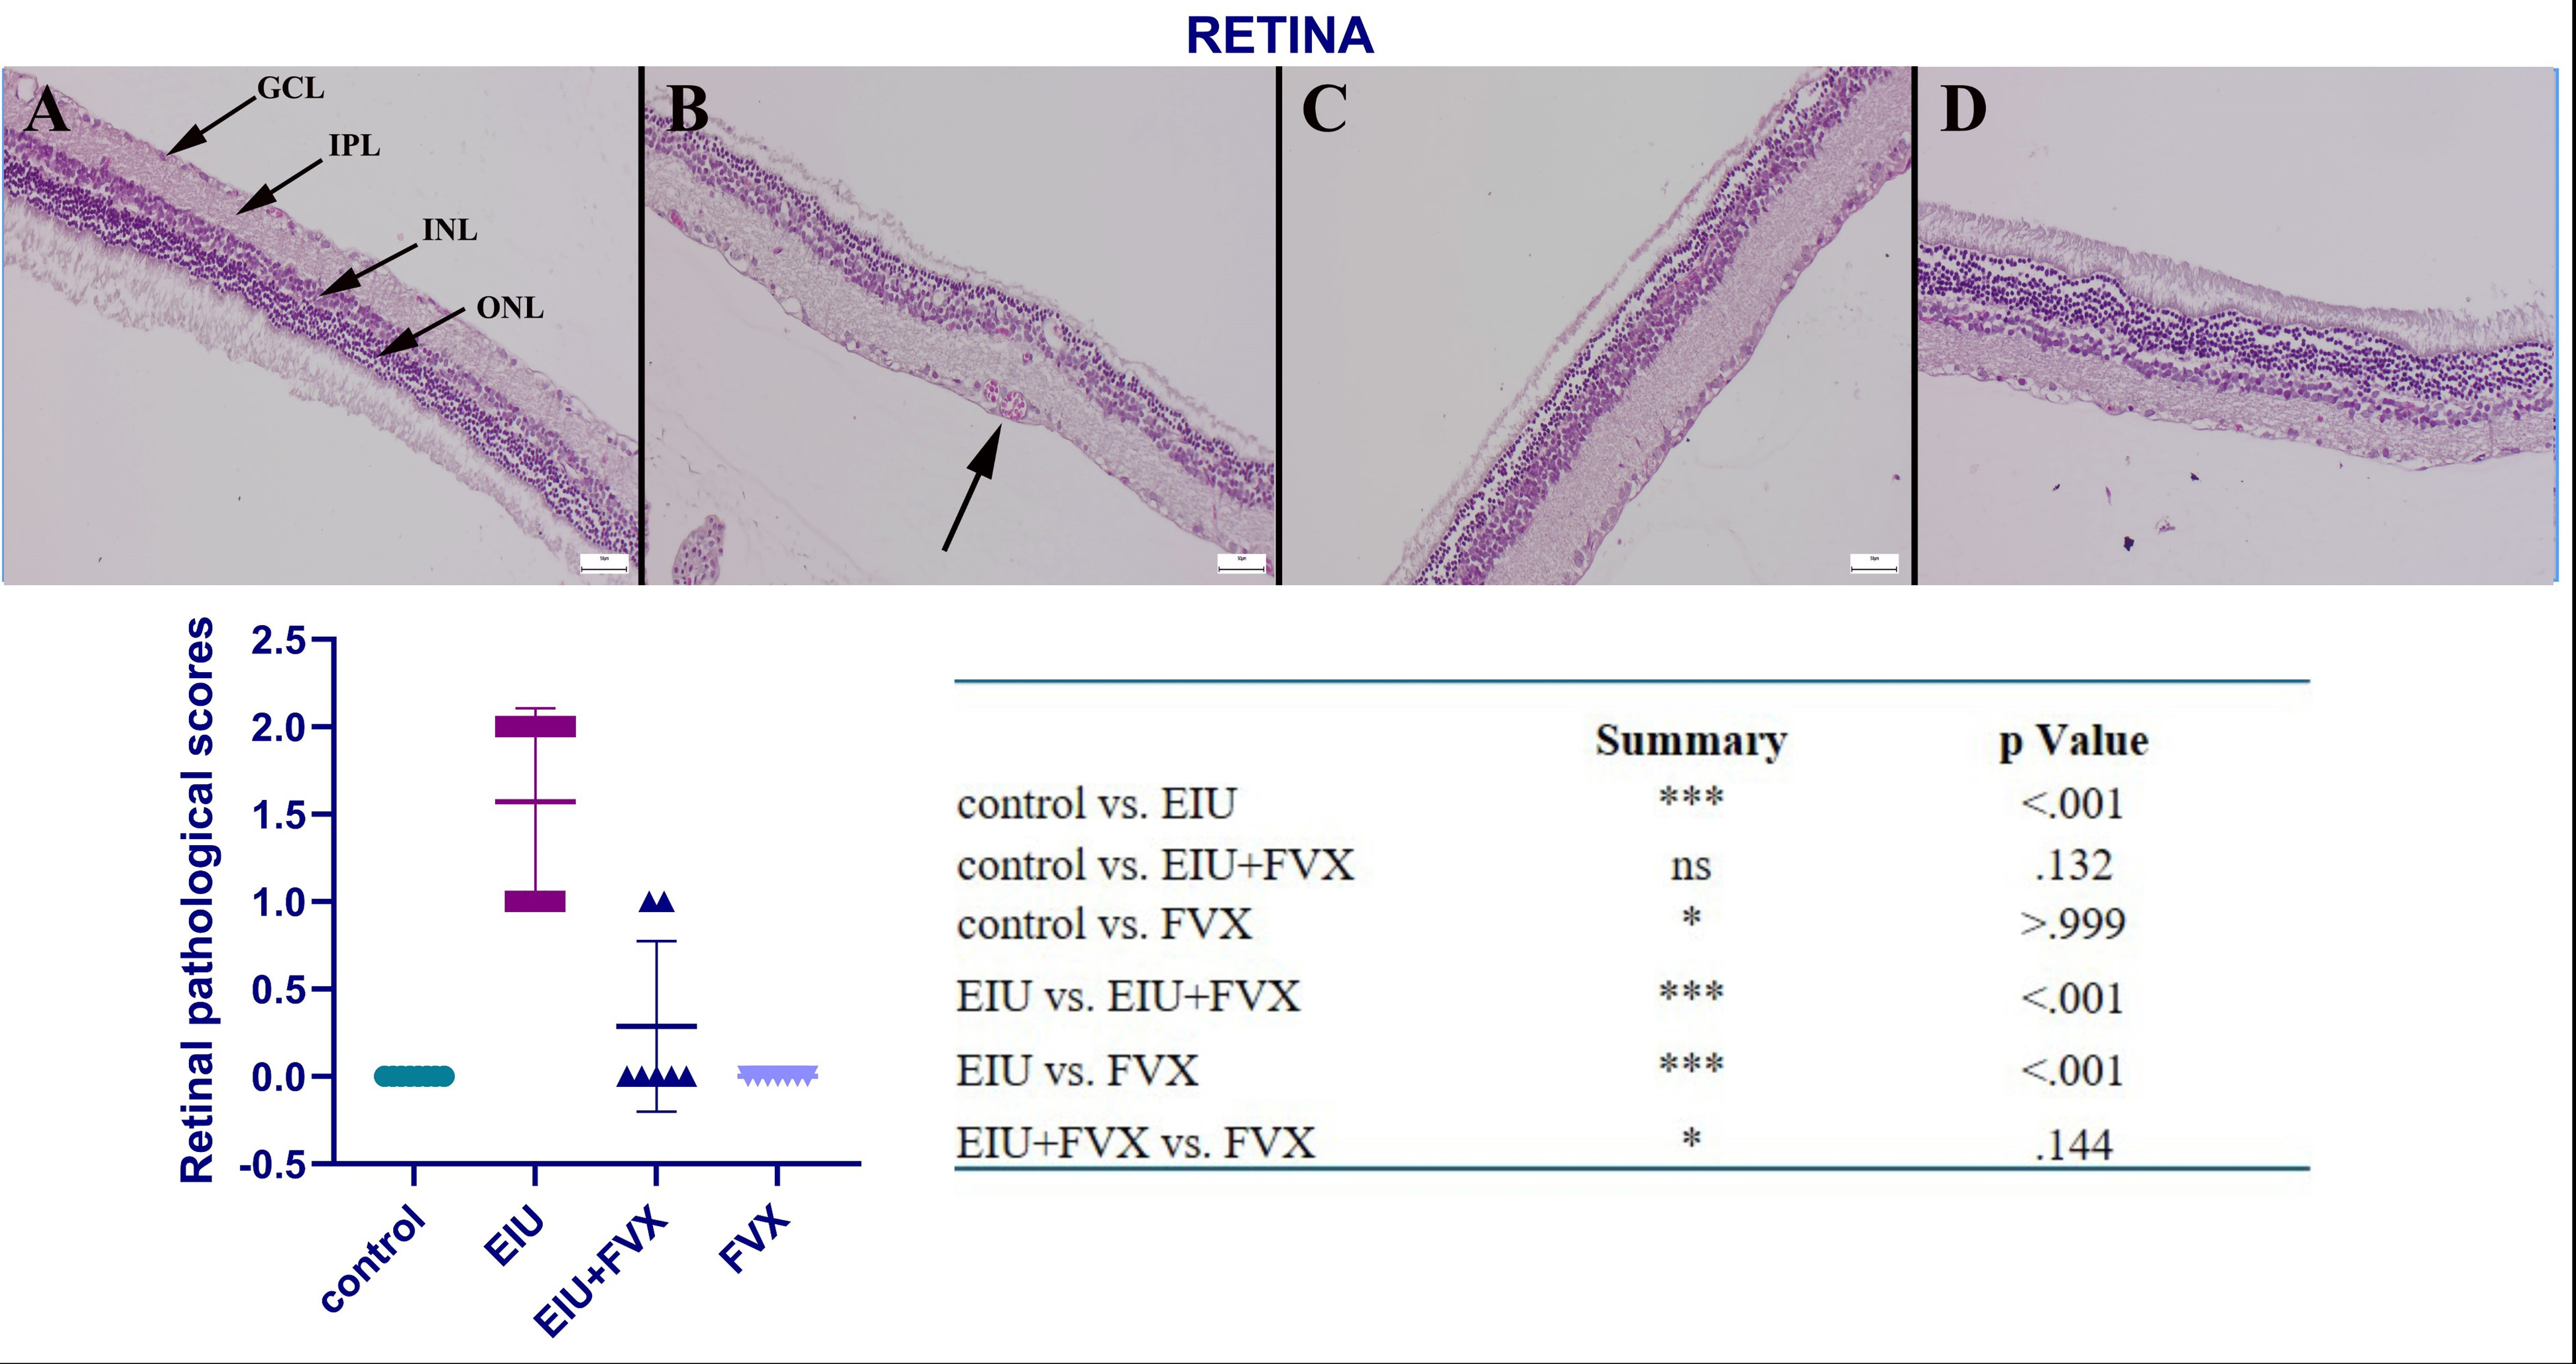
 Figure 4 of
Sofu, Mol Vis 2026; 32:255-263.
Figure 4 of
Sofu, Mol Vis 2026; 32:255-263.