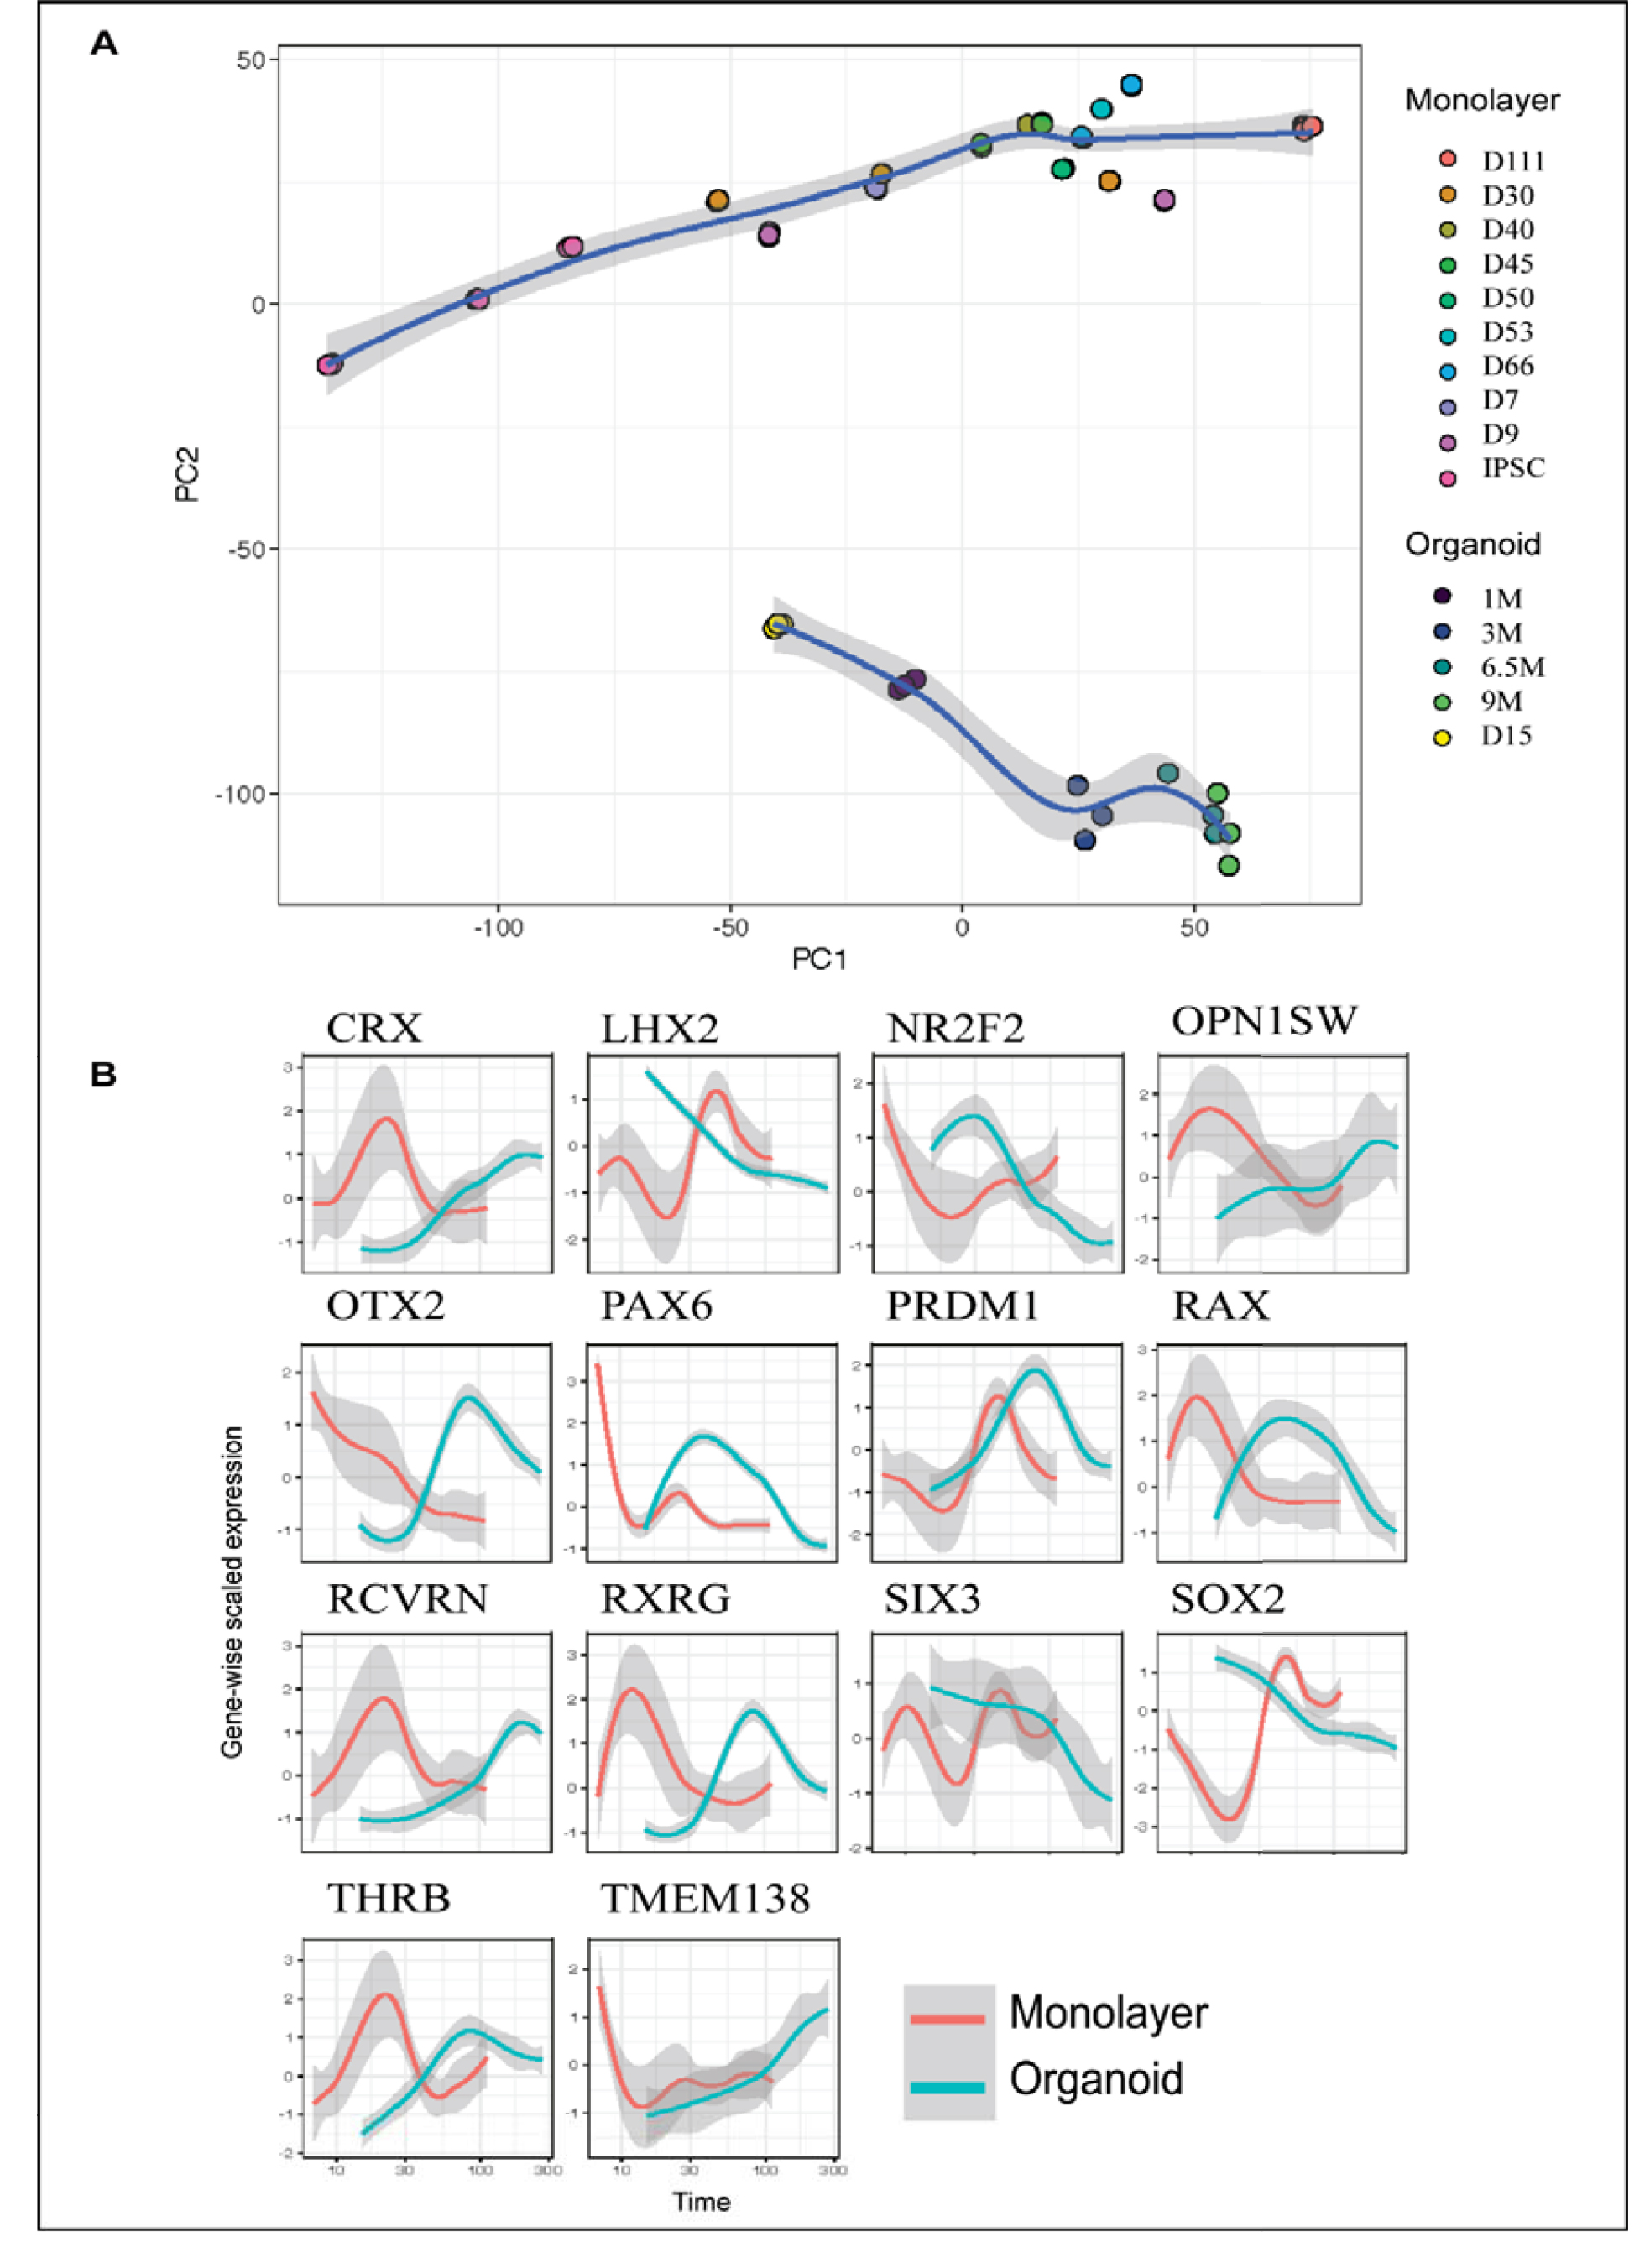
Figure 8. Comparative transcriptomic analysis of photoreceptor differentiation in 2D monolayer versus 3D organoid cultures.
A: Principal component analysis (PCA) of average gene expression trajectories across all time points from three independent
PGP1-IPSC photoreceptor differentiation experiments (top line) and retinal organoid differentiation obtained from [
42] over a 9-month culture period (bottom line). The divergence in trend lines highlights substantial differences in transcriptional
dynamics between the two culture paradigms.
B: Expression profiles of a selected subset of genes monitored throughout differentiation, illustrating distinct expression
patterns between monolayer directed differentiation and 3D organoid culture conditions
.  Figure 8 of
Beaver, Mol Vis 2026; 32:232-xxx.
Figure 8 of
Beaver, Mol Vis 2026; 32:232-xxx.