Figure 6. Principal component analysis (PCA) and characterization of hIPSC-derived photoreceptor (PhR) differentiation across three
independent experiments. A: PCA plot showing technical replicates clustering closely, indicating reproducibility, while experimental groups display
variation in gene expression across differentiation time points (D7, D9, D30, D40, D45, D50, D53, D66, D111). B: Combined PCA trajectory illustrating changes in the first principal component (PC1) over time across all experiments. C: Individual PCA trajectories of PC1 for each differentiation experiment (Exp 1, Exp 2, Exp 3), demonstrating a general upward
trend in PC1 values over time, with variability during early differentiation stages. D: Heatmap of cluster analysis of differentially expressed genes, highlighting gene expression patterns associated with photoreceptor
development across all three experiments and time points. E: Scanning electron microscopy of D99 differentiated cells (Exp 3), revealing surface morphology and spatial organization,
including defined cell bodies (cb), presumptive connecting cilia (ml), and potential plasma membrane proteins (pp) suggesting
intercellular connectivity.
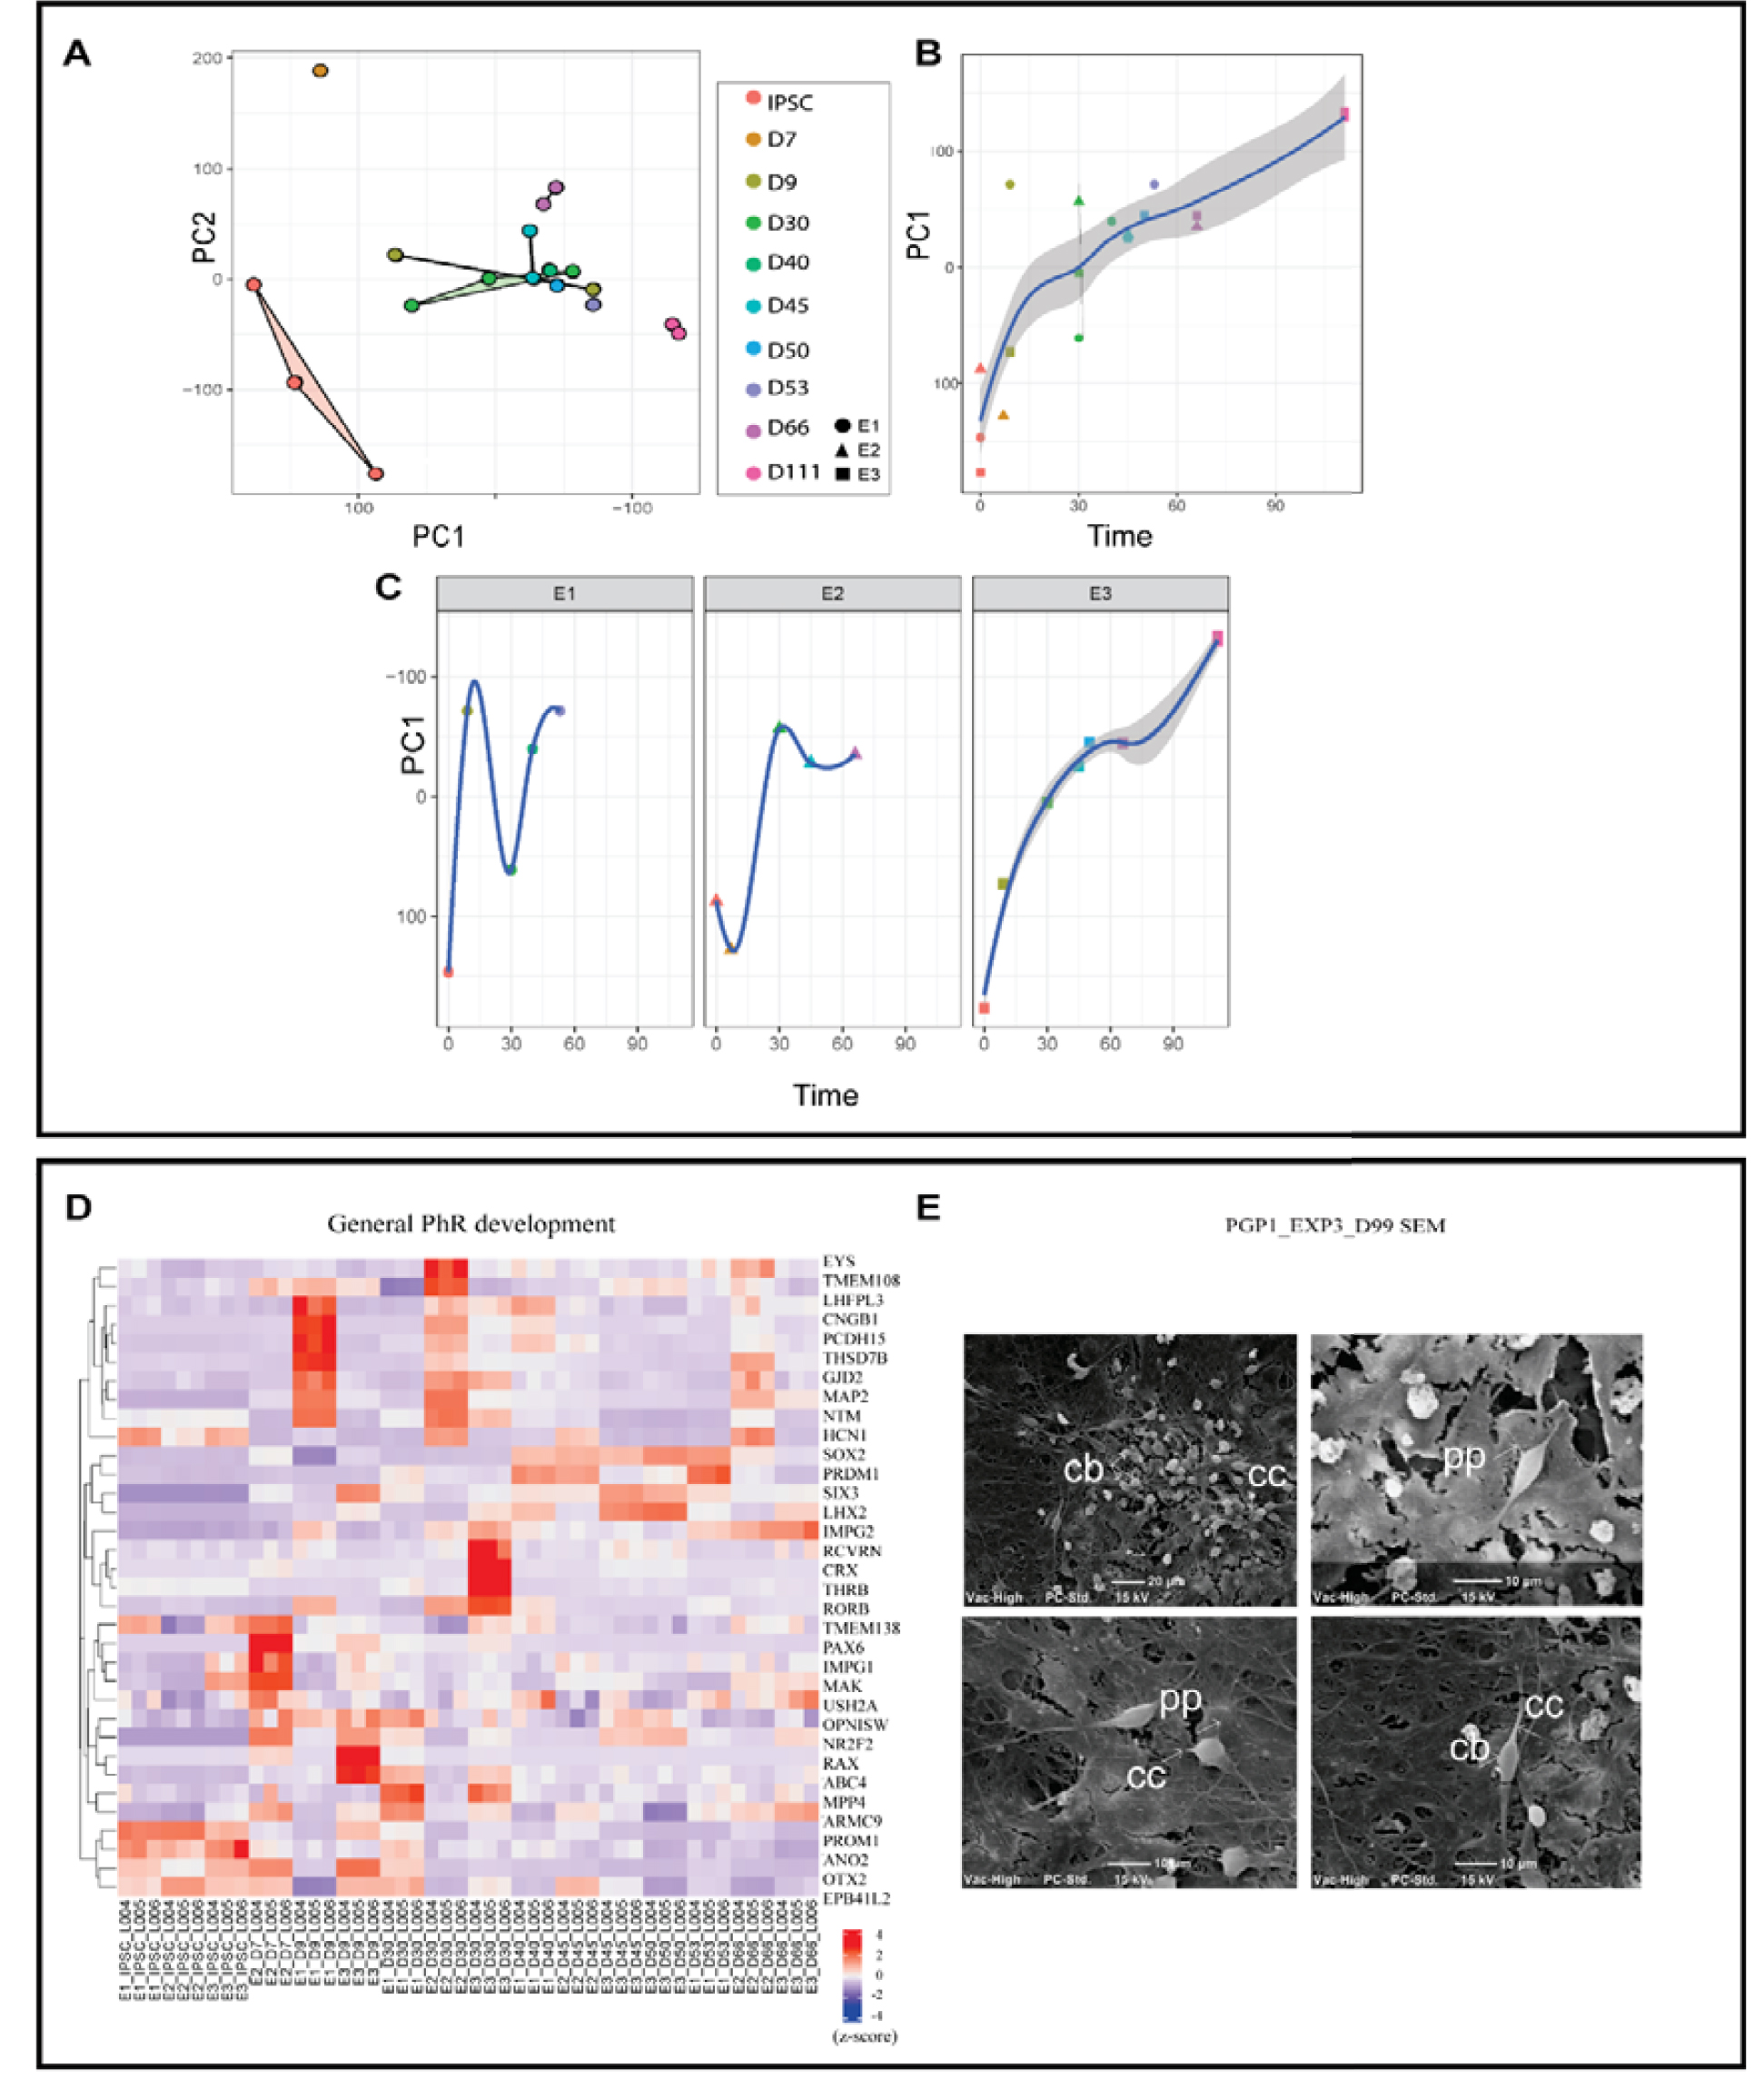
 Figure 6 of
Beaver, Mol Vis 2026; 32:232-xxx.
Figure 6 of
Beaver, Mol Vis 2026; 32:232-xxx.