Figure 5. Effects of TLR9 agonist ODN 1826 on gene expression of TLR9 downstream signaling components and AMD associated proteins in
RPE cells. RPE cells were cultured in presence of ODN 1826 (1 µM) for 2, 6 and 24 h. The mRNA amounts were examined with qPCR.
Results are shown as fold changes to unstimulated controls. QPCR negative controls were performed with double-distilled water
instead of cDNA. ACTB was used to normalize the results. Secreted TGF-β1 protein was analyzed in cell culture supernatants (24 h) using ELISA.
The results are shown as percentage of the untreated control. The gene expression of the following factors was investigated:
A: TLR9 (n=4–5), B: TLR9 adaptor protein MYD88 (n=4–5), C: transcription factor IRF7 (n=4–6), D: transcription factor RELA (the gene of p65 subunit of transcription factor NF-κB, n=5), E: IFNA (n=5–6), F: COX2 (n=6), G: VEGFA (n=5–6), H:TGFB1 (n=6), I: MMP2 (n=4), and J: MMP9 (n=4). K: The protein secretion of TGF-β1 (n=3) is presented. Each bar (mean ± SEM) shows results from independent experiments using
RPE cells from different human eye donors. Mann–Whitney-U-Test was used for statistical analysis of the qPCR results. One-way
ANOVA followed by Bonferroni’s multiple comparison test was used to analyze the ELISA-results. Significant difference versus. unstimulated controls: *p<0.05.
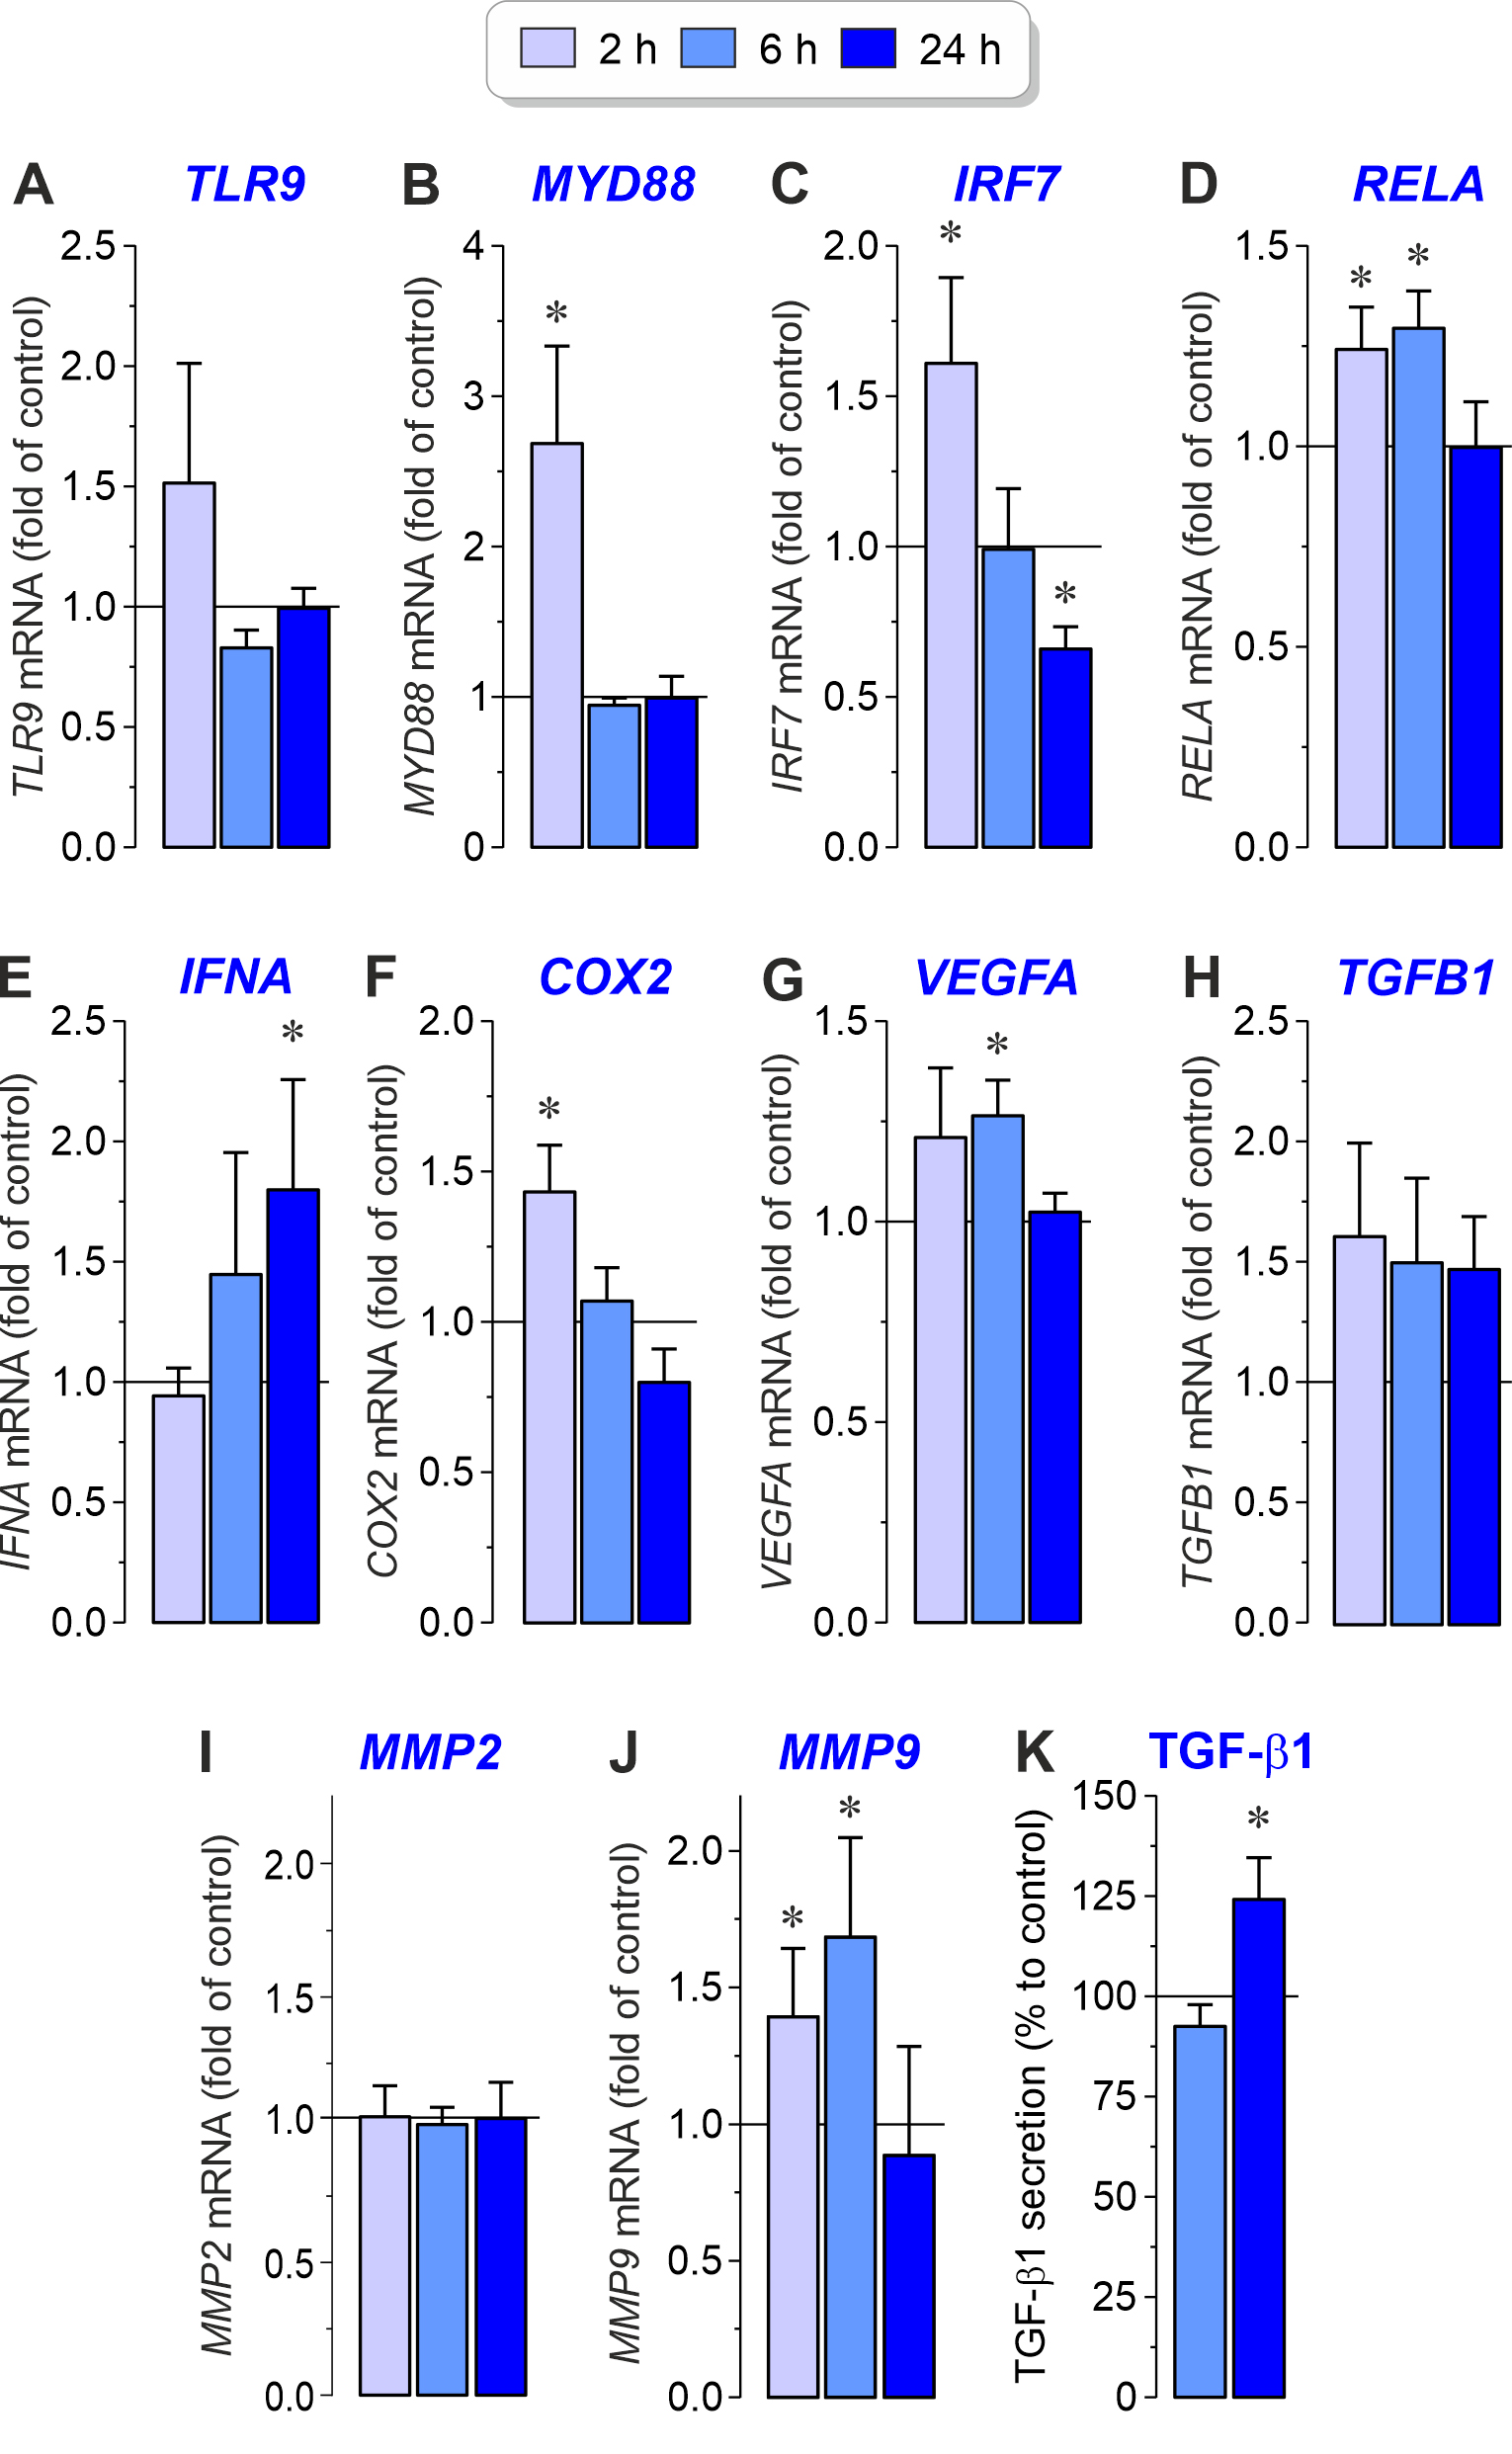
 Figure 5 of
Esser, Mol Vis 2026; 32:210-230.
Figure 5 of
Esser, Mol Vis 2026; 32:210-230.