Figure 4. Expression of phosphorylated histone H2A.X (γH2A.X) protein in cultured human RPE cells. Cells were cultured in presence of
CoCl2 (150 µM), NaCl (+100 mM) or in a 0.1% O2 atmosphere for 24 h. A: Representative western blots of γH2A.X protein using 30 µg whole cell protein extract. β-actin was used as loading control.
The image shows two examples of 4 experiments. B. Signals quantified by densitometry and normalized with β-actin are shown in relation to the untreated control (100). C: The amount of cell-free DNA released from RPE cells that were cultured under hyperosmotic (+100 mM NaCl) as well as hypoxic
conditions (CoCl2, 0.1% O2 atmosphere) for 24 h. The results are shown as a percentage of the untreated control group. (100). Each bar represents data
from 4 (western blot) and 5 (cell-free DNA) independent experiments with cells from different donors. The statistical analysis
was performed using the One-way ANOVA followed by Bonferroni’s multiple comparison test. Significant difference versus. unstimulated control: *p<0.05. .
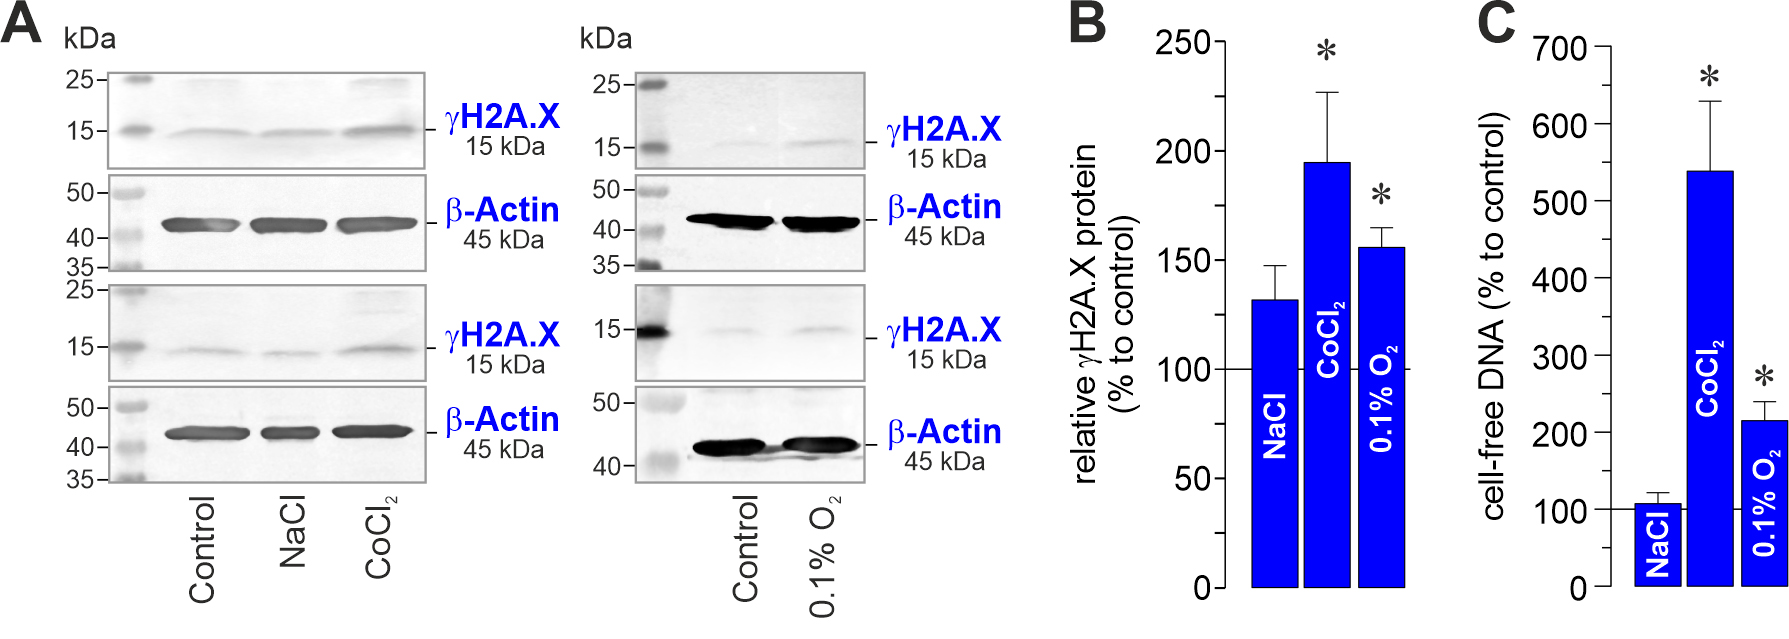
 Figure 4 of
Esser, Mol Vis 2026; 32:210-230.
Figure 4 of
Esser, Mol Vis 2026; 32:210-230.