Figure 2. Regulation of TLR gene expression in cultured human RPE cells. Relative mRNA levels were evaluated by qPCR and are shown as folds of unstimulated
control. The cells were stimulated for 2, 6, and 24 h, as indicated by the color of the bars. A: Effect of chemical hypoxia induced by CoCl2 (150 µM, n=3–5). B: Effect of cell culture in a 0.1% O2 atmosphere on the TLR gene expression (n=4). C: Effect of extracellular hyperosmolarity induced by addition of 100 mM NaCl to the culture medium (n=3–5). D: Effect of addition of 200 mM sucrose (n=3–4) and (E) extracellular hypoosmolarity (60% osmolarity, n=5) on the TLR9 gene expression. F: Effects of fetal bovine serum (10%, n=3–4) and thrombin (10 U/ml, n=4–5) on the TLR9 gene expression (G). Influence of growths factors such as VEGF (n=5) or TGF-β1 (n=3; each 10 ng/ml) on TLR9 gene expression. H: Effect of Triamcinolone acetonide (50 µM) on TLR9 mRNA (n=4–5). ACTB and B2M were used to normalize the results for CoCl2 as well as 0.1% O2. ACTB was used to normalize the results of NaCl, sucrose, hypoosmolarity, serum, thrombin, VEGF, TGF-β1, and Triamcinolone. Each
bar represents data from independent experiments using cells from different donors. The statistical analysis was performed
using the non-parametric Mann–Whitney-U-Test. Results are shown as mean ± SEM. Significant difference versus unstimulated
control: *p<0.05.
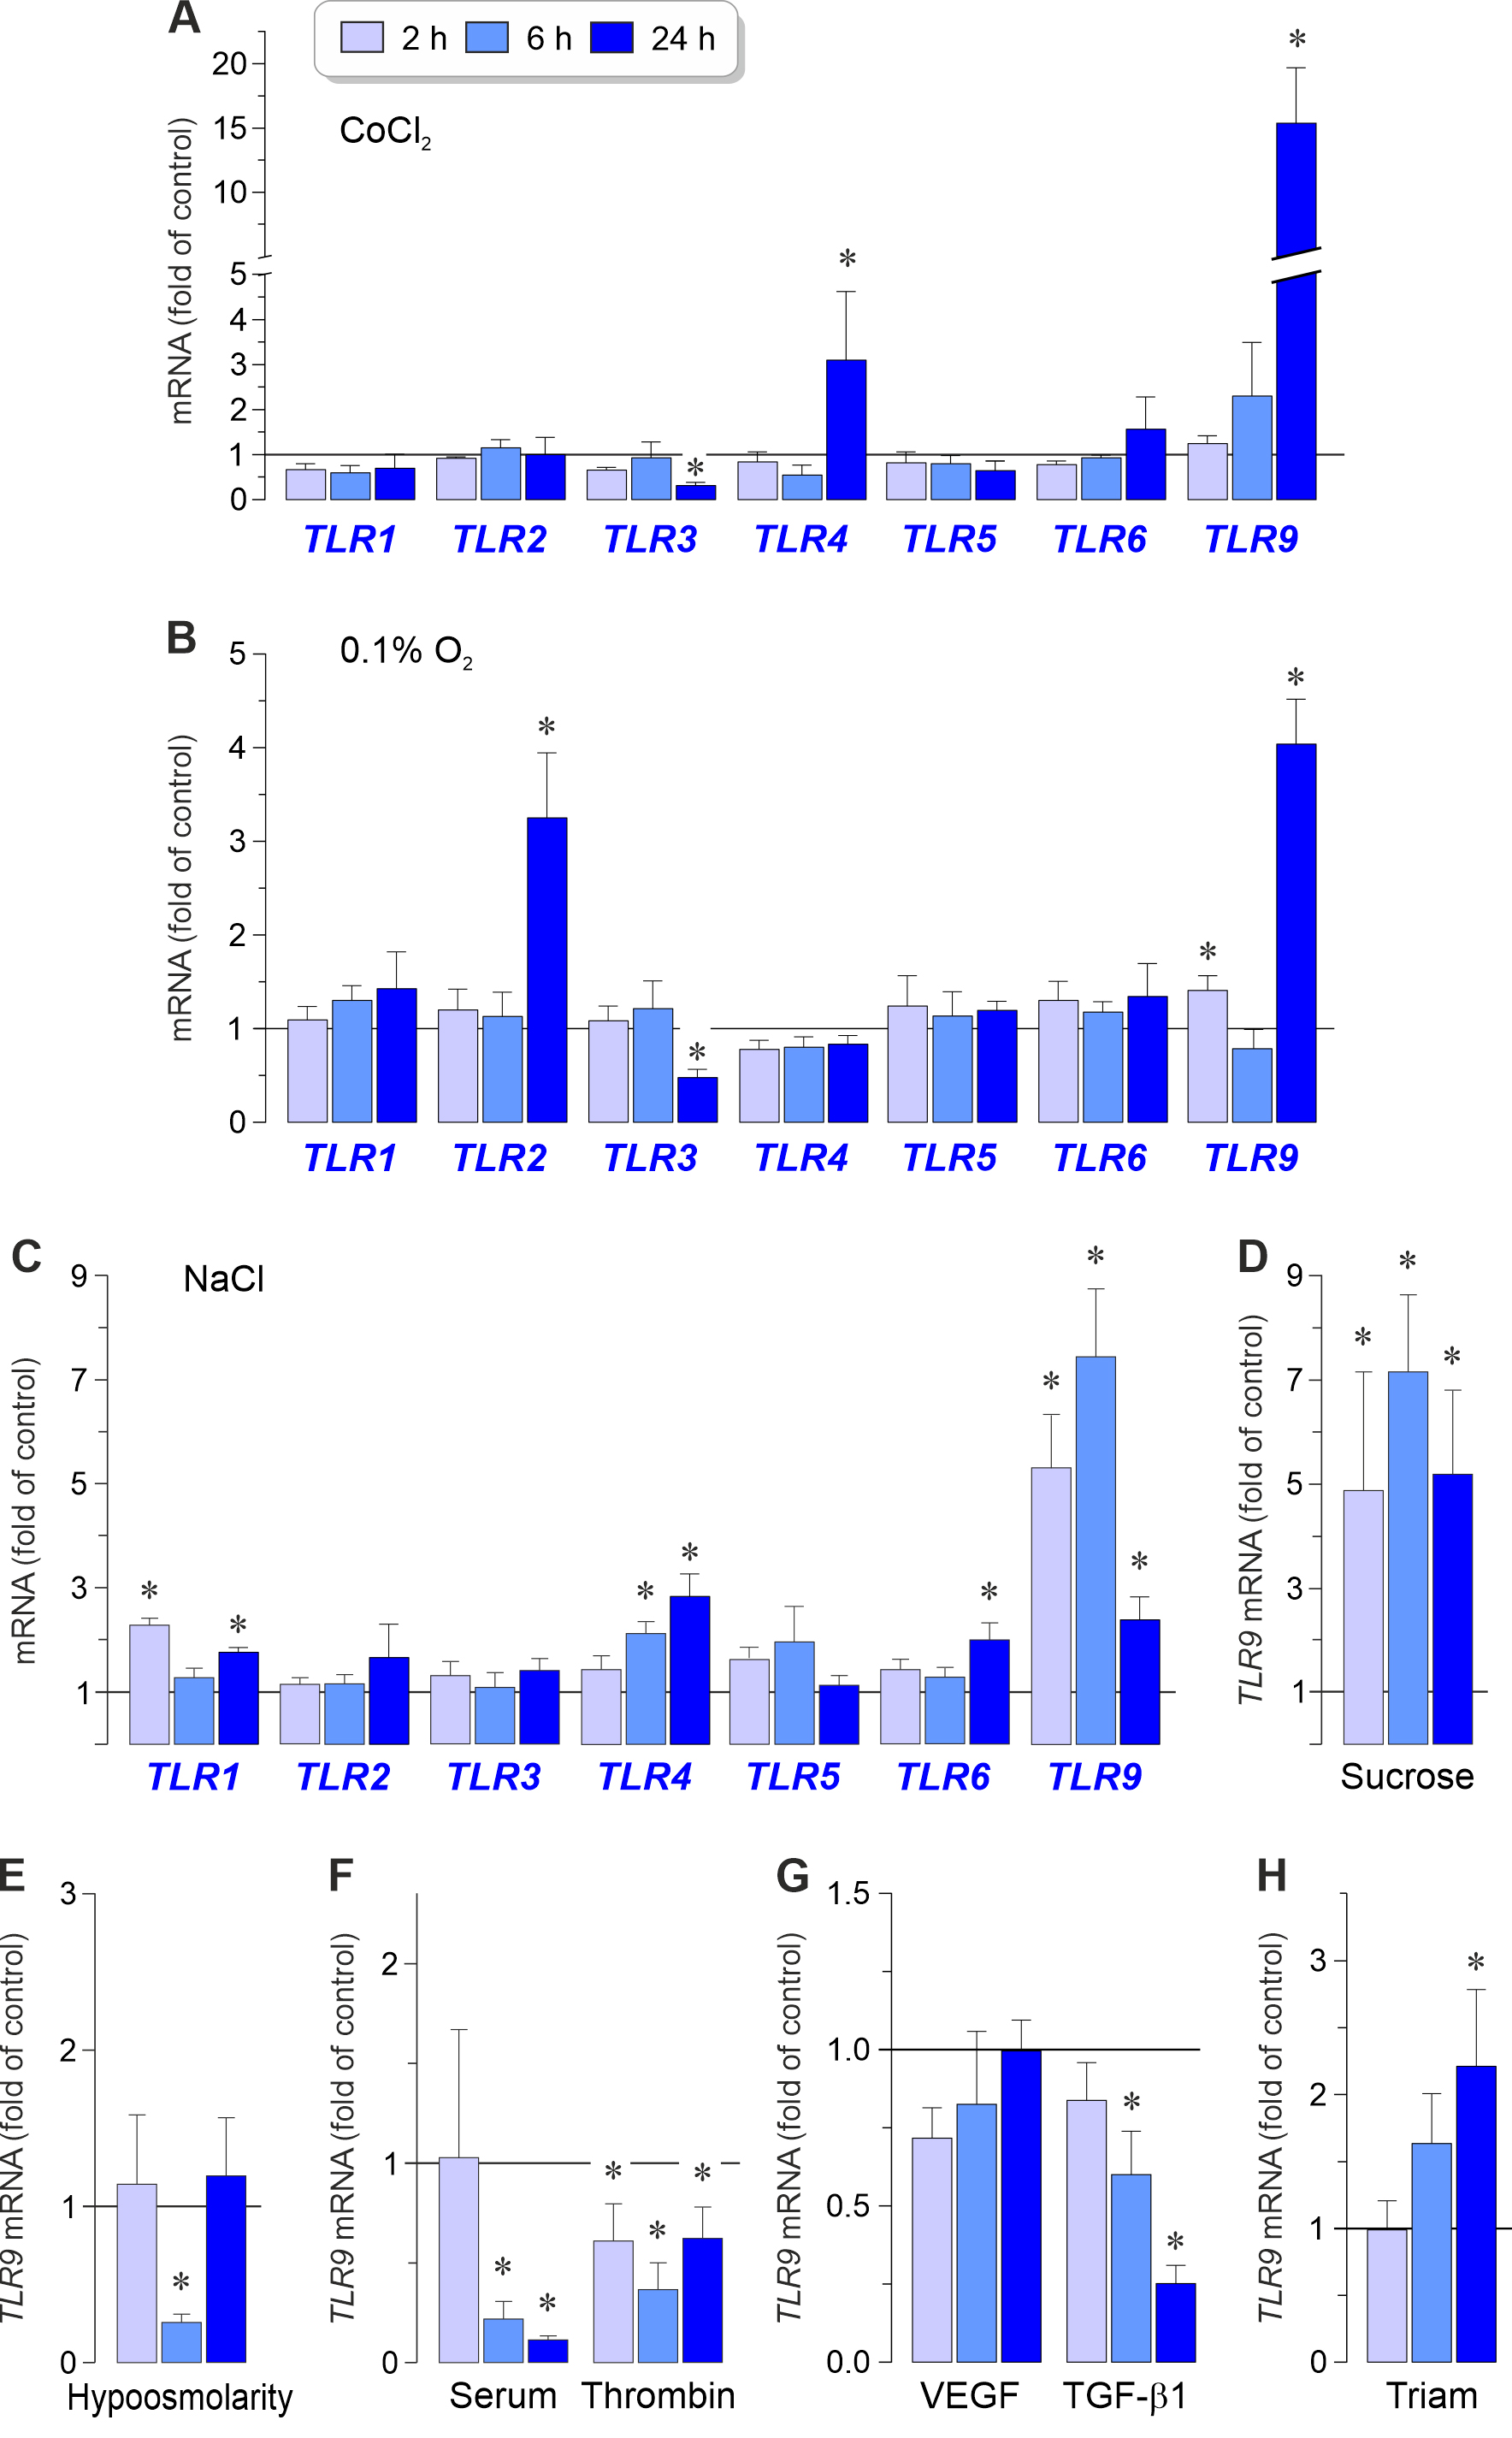
 Figure 2 of
Esser, Mol Vis 2026; 32:210-230.
Figure 2 of
Esser, Mol Vis 2026; 32:210-230.