Figure 1. Expression of Toll-like receptor (TLR) genes in human RPE cells. A: Agarose gel electrophoresis images of gene transcripts which was performed with PCR products of acutely isolated cells from
two different post-mortem donors (a1, a2). 0, negative control done by adding double-distilled water instead of cDNA as a
template. β-actin (ACTB) mRNA was used to normalize TLR mRNA levels in qPCR analysis. B: Comparison of TLR gene expression levels in acutely isolated and cultured RPE cells. The data were determined by qPCR. The bars show the mean
of cycle numbers at the threshold of transcript detection ± SD. Cells derived from 5 (acutely isolated) and 9 (cultured) donors,
respectively, were used. The statistical analysis was performed using non-parametric Mann–Whitney-U-Test. Significant difference
between acutely isolated and cultured cells: *p<0.05.
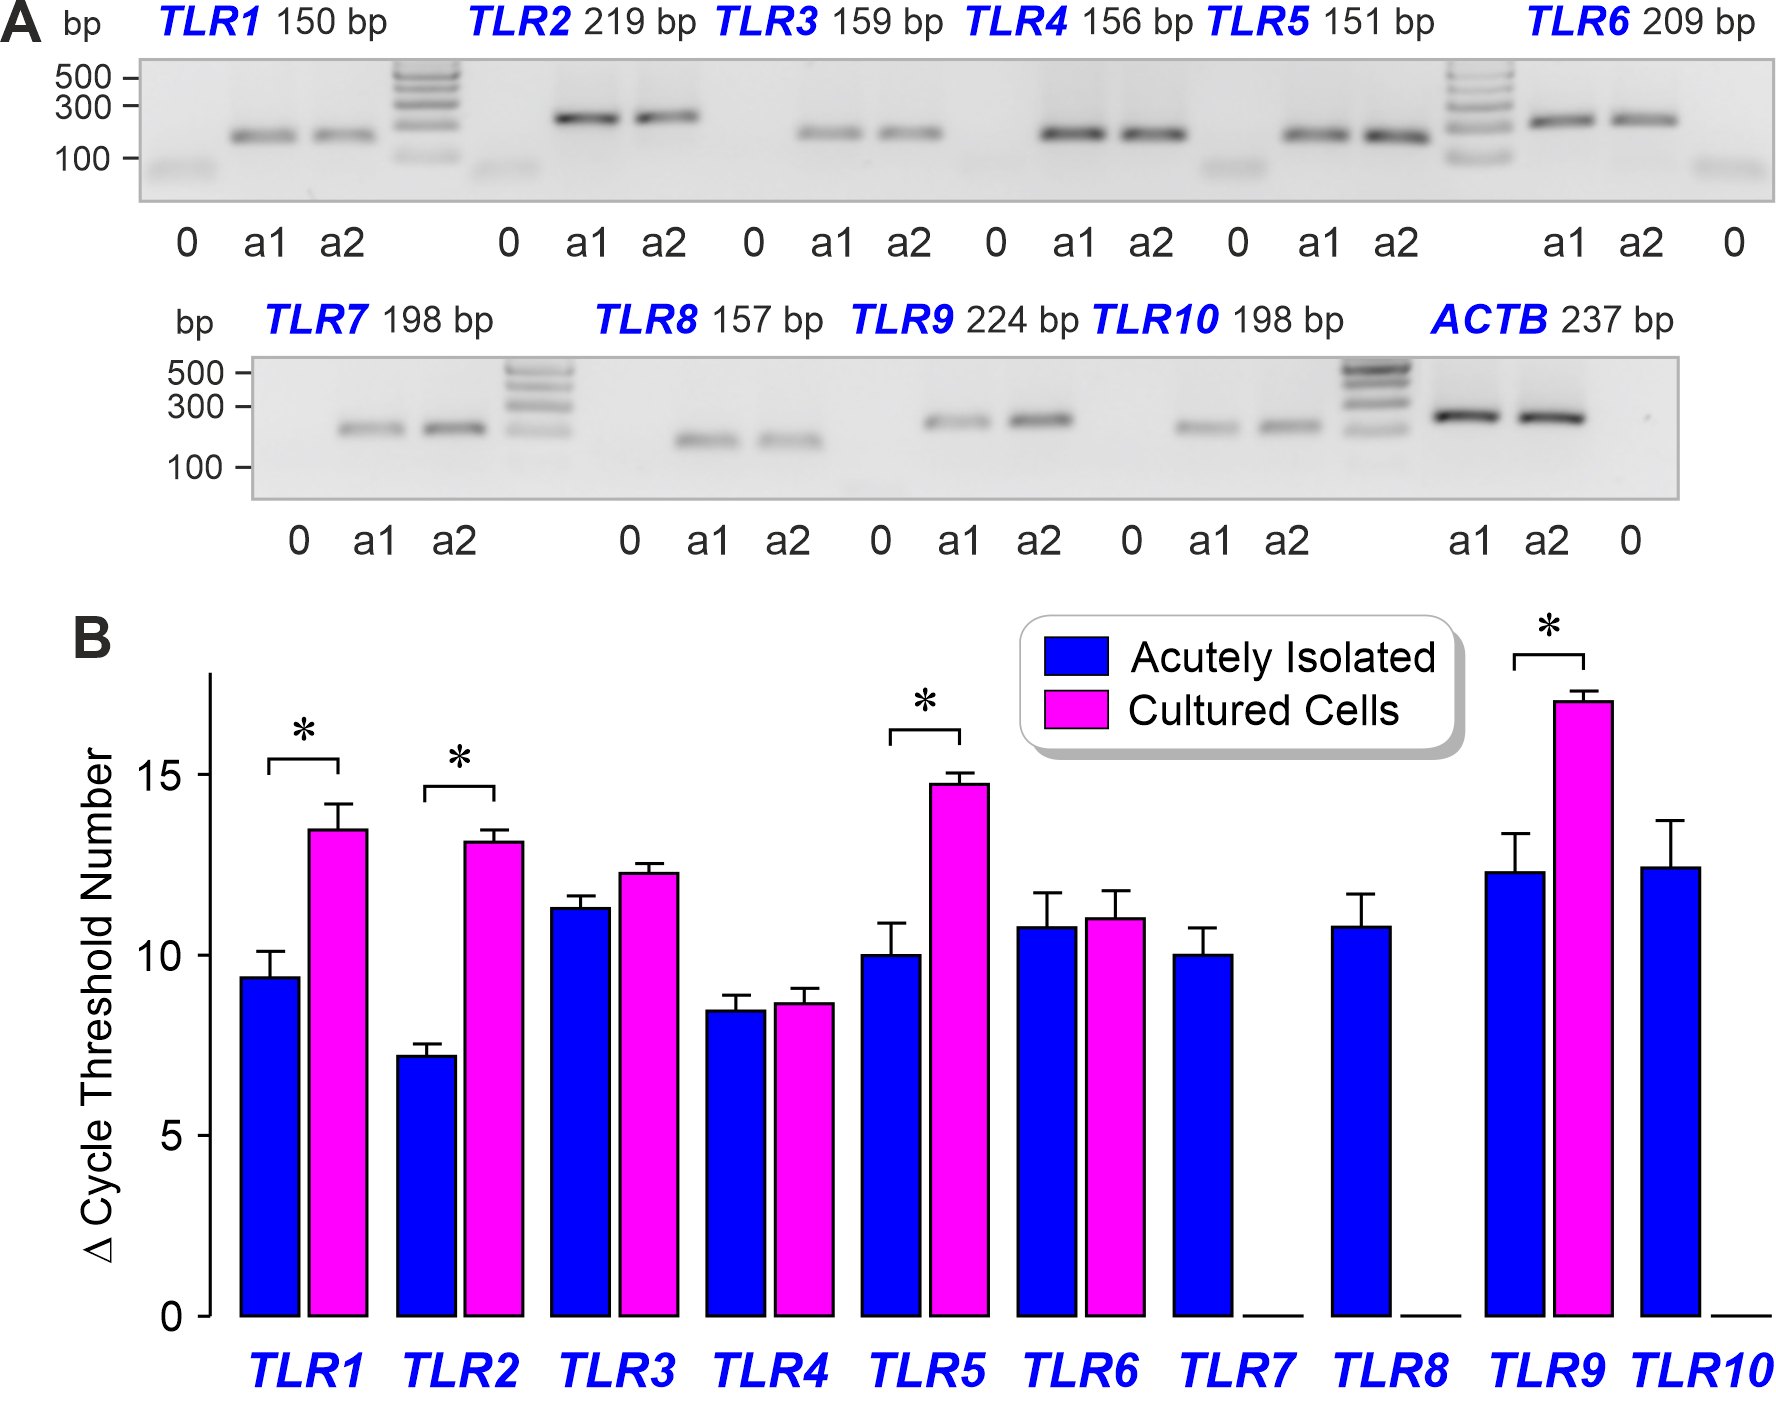
 Figure 1 of
Esser, Mol Vis 2026; 32:210-230.
Figure 1 of
Esser, Mol Vis 2026; 32:210-230.