Figure 3. Gomori stain showing collagen within explant tissue. Selected micrograph of retinal explant sections at t=0 (A and B, 200X), 4 h (C, 200X) and 24 h (D, 400X). A,control micrograph stained with eosin only), B (t=0.5 h), C and D stained Gomori stain and counterstained with eosin. Eosin stain reveals cytoplasmic detail while Gomori stain reveals bluish
green collagen. Pink/red stain indicates erythrocytes and cytoplasmic contents of cells. Sections were not counterstained
with hematoxylin in order not to mask any positivity for collagen.
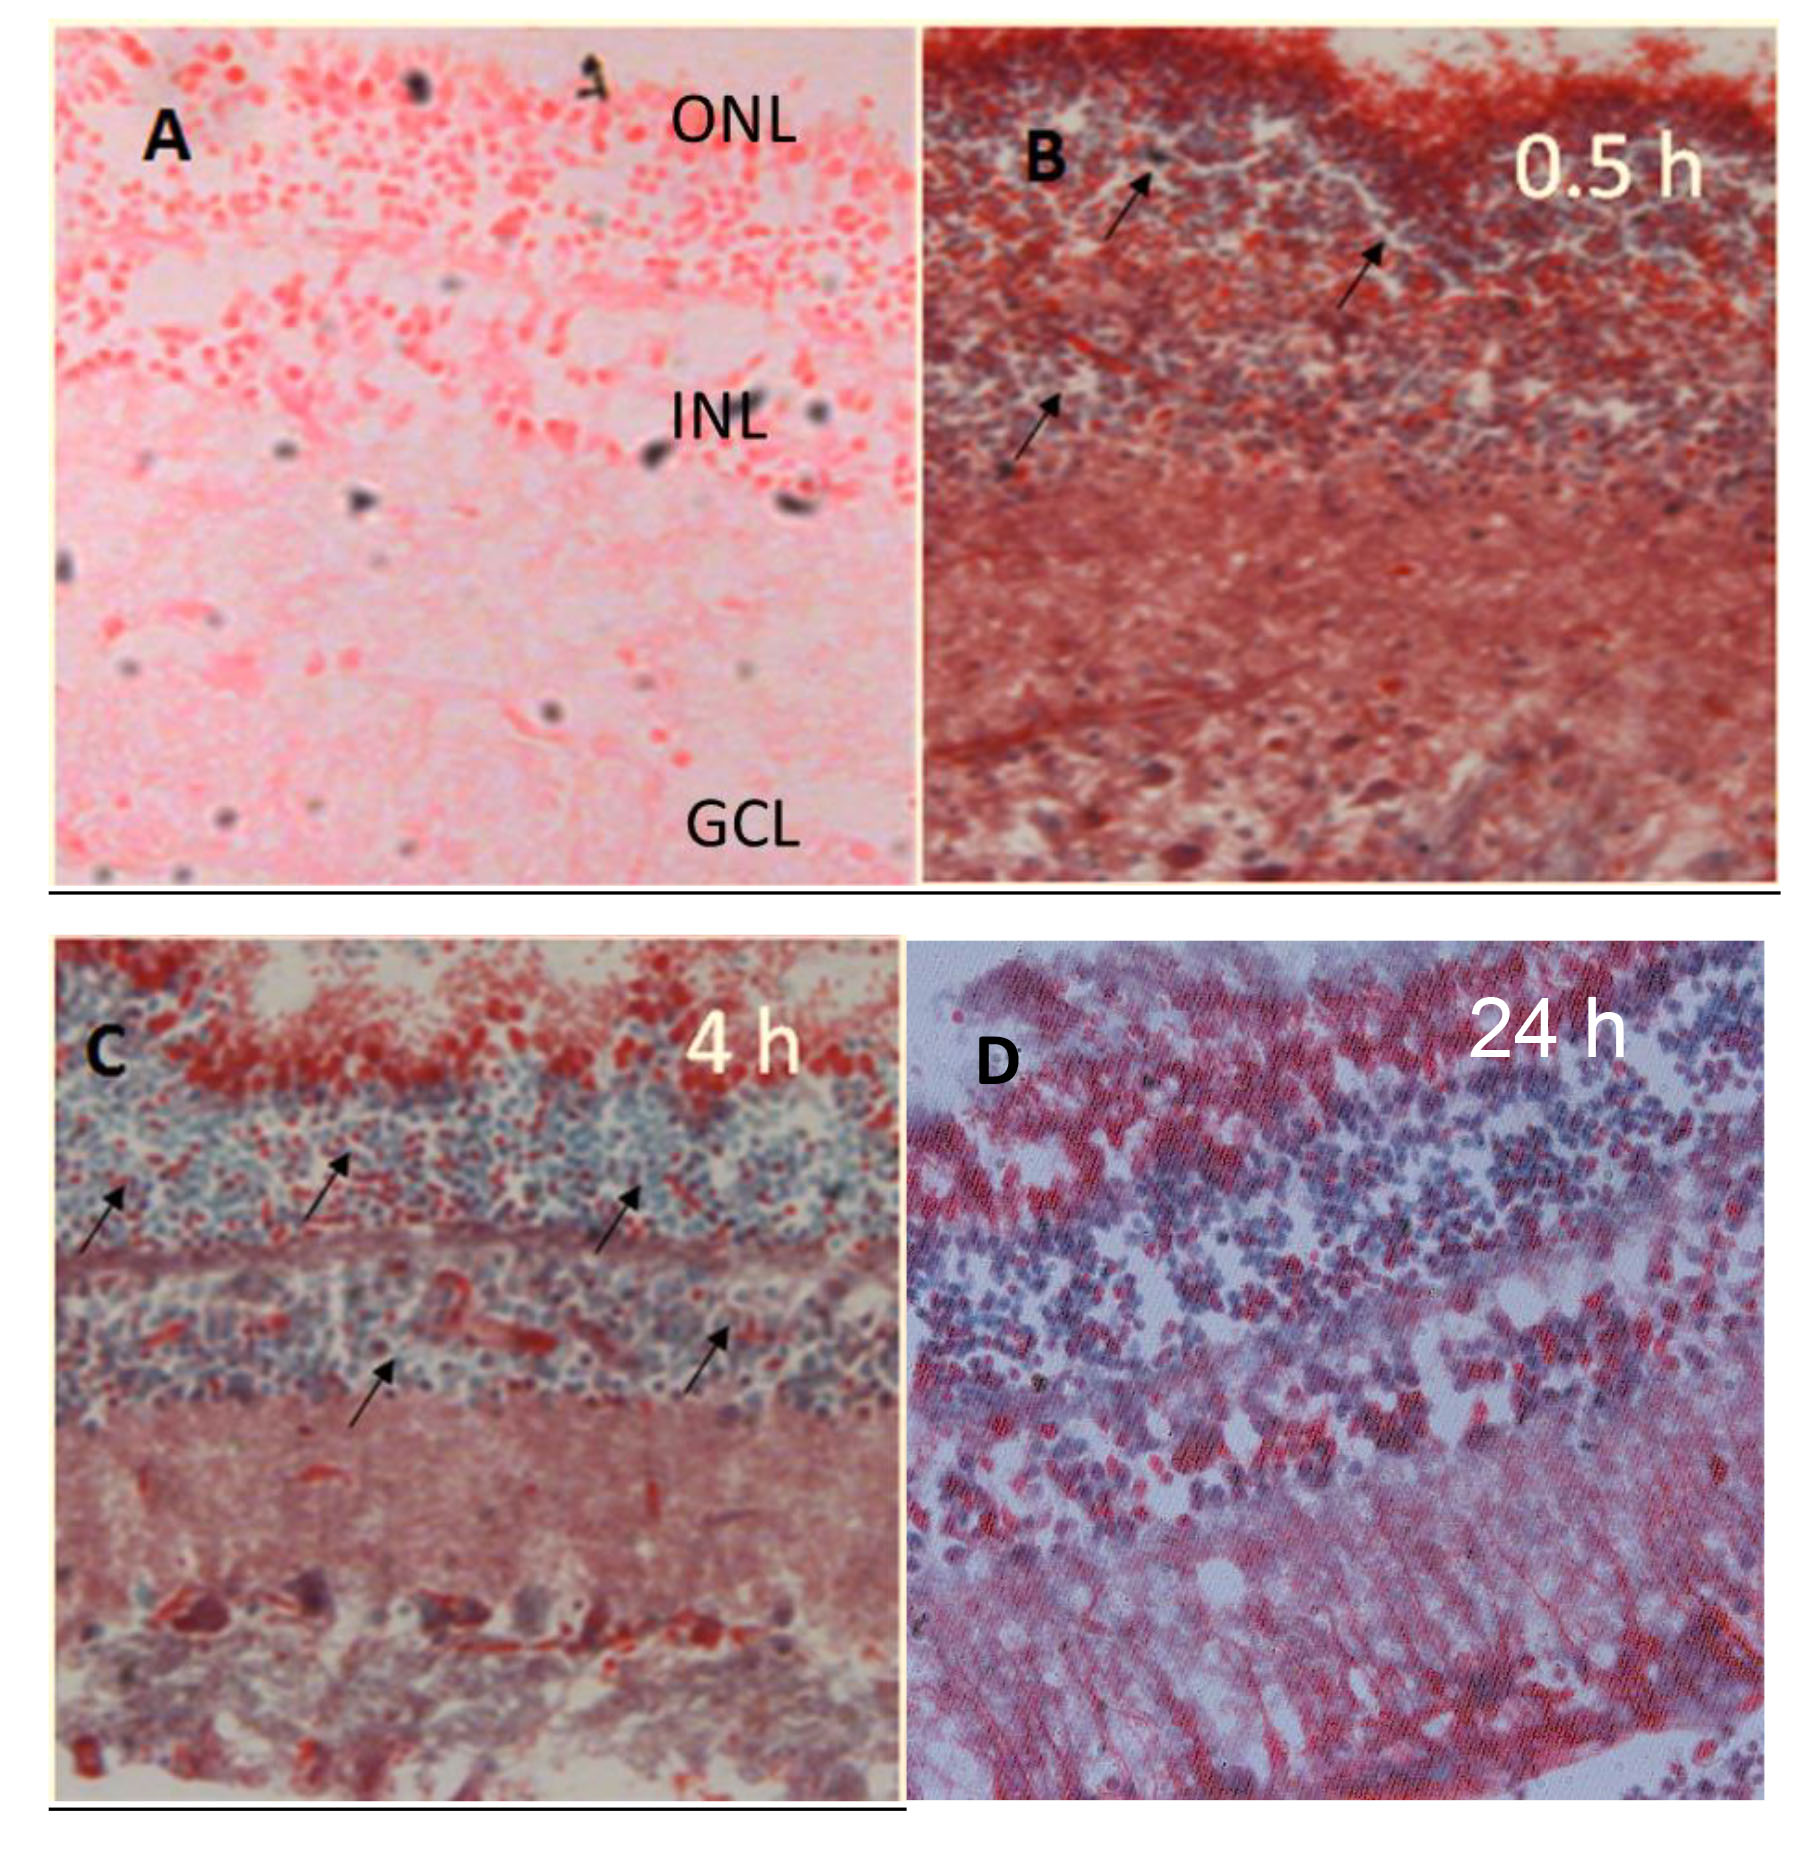
 Figure 3 of
Iwuagwu, Mol Vis 2026; 32:186-194.
Figure 3 of
Iwuagwu, Mol Vis 2026; 32:186-194.