Figure 9. Two-photon fluorescence (TPF) imaging results. A–F: Noise-thresholded TPF images from control (A–C) and WST11/NIR-treated (D–F) rabbit sclera specimens at superficial (A, D), mid (B, E), and deep (C, F) tissue depths. Single arrowheads: a branched network of thin, straight fibers is observed throughout the stroma in all specimens.
Double arrowheads: additional thicker and wavier fibrous structures are visible in the superficial and mid-stromal depths
of WST11/NIR-treated specimens only. G–I: TPF image fraction is significantly increased in the superficial and mid-stroma but is marginally and nonsignificantly reduced
in the deep stroma. J–L: A corresponding trend is also observed for total (summed) segmented TPF signal. Error bars denote standard deviation.
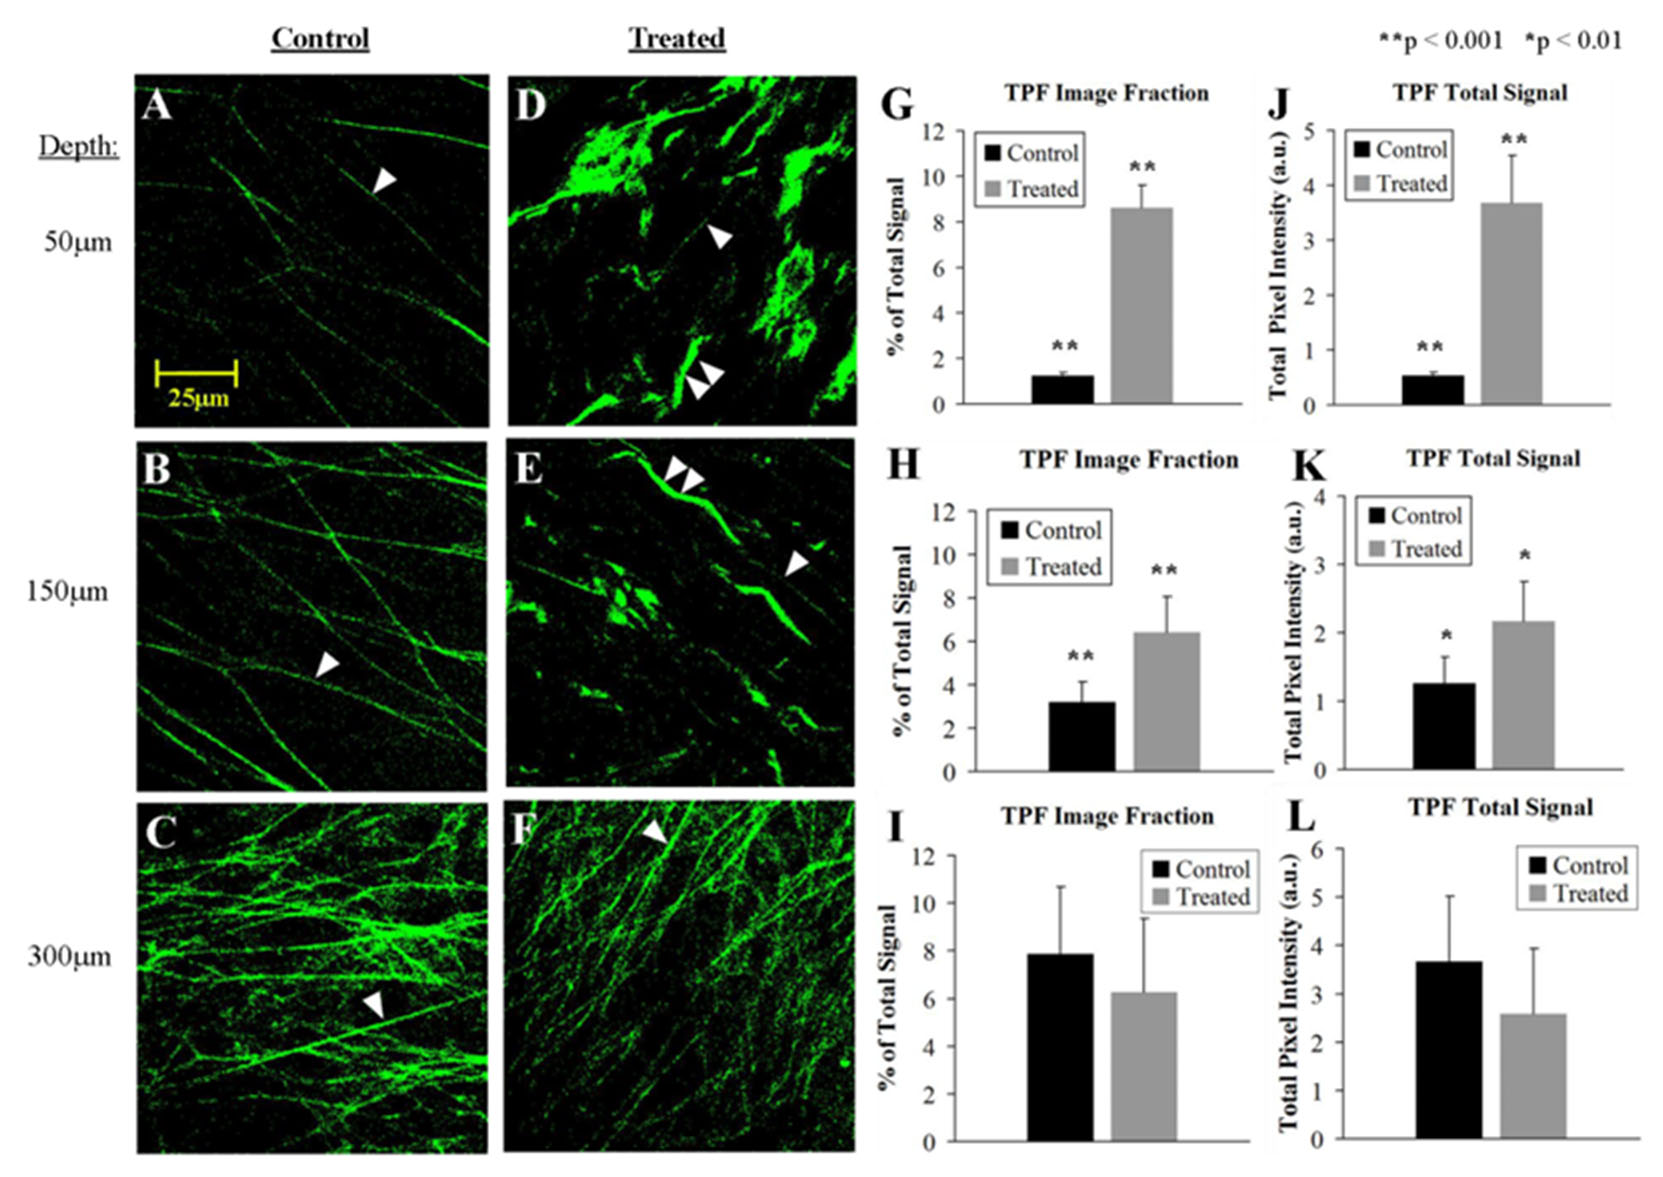
 Figure 9 of
Ma, Mol Vis 2026; 32:169-184.
Figure 9 of
Ma, Mol Vis 2026; 32:169-184.