Figure 7. X-ray scattering results. Polar vector plots of scleral collagen orientation distribution for four control/treatment sample
pairs, as determined using wide-angle X-ray scattering (WAXS). For each plot, the length of vector r represents the relative number of collagen molecules aligned at angle ϕ within the scleral plane, as an average through the
tissue thickness.
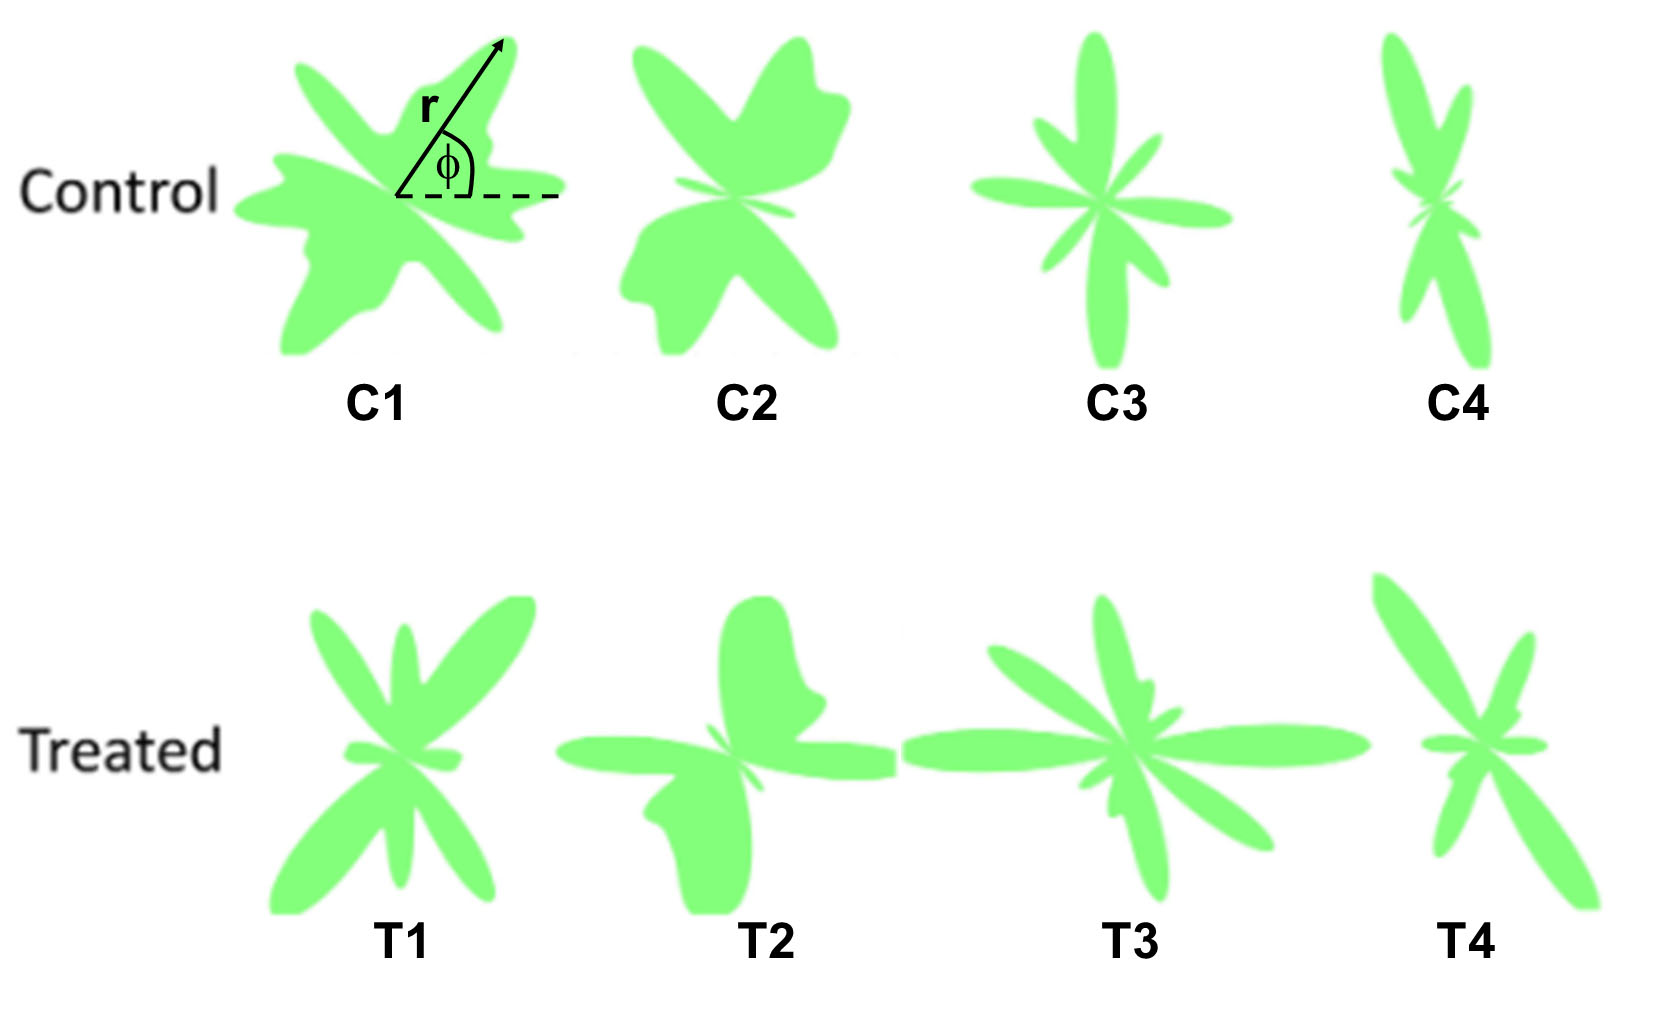
 Figure 7 of
Ma, Mol Vis 2026; 32:169-184.
Figure 7 of
Ma, Mol Vis 2026; 32:169-184.