Figure 4. Tensile test results. A: Group-averaged stress versus strain behavior of control (solid line) and WST11/NIR treated (broken line) rabbit scleral
strips. B: Corresponding values of tangent modulus (Etan) as a function of strain. Error bars denote standard deviation.
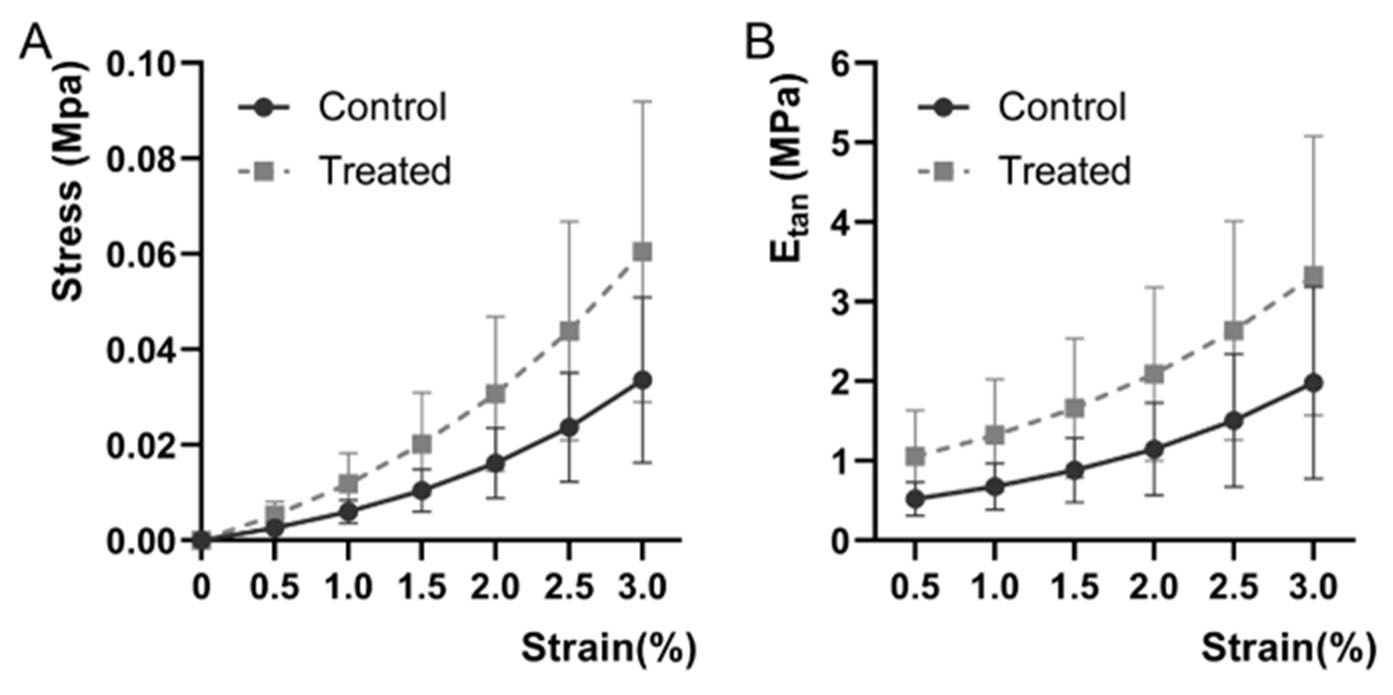
 Figure 4 of
Ma, Mol Vis 2026; 32:169-184.
Figure 4 of
Ma, Mol Vis 2026; 32:169-184.