Figure 2. Wide-angle X-ray scattering (WAXS) analysis. A: WAXS pattern recorded from rabbit sclera. The collagen intermolecular spacing (IMS) peak (black arrowhead) is circumferentially
integrated, and the radial profile is extracted along the direction of the white arrow. B: A power-law background function (broken line) of the form I = aRb, where a and b are constants, is fitted to the extracted intensity data (solid line). C: Background removal allows the pixel position of the IMS peak (arrow) to be measured.
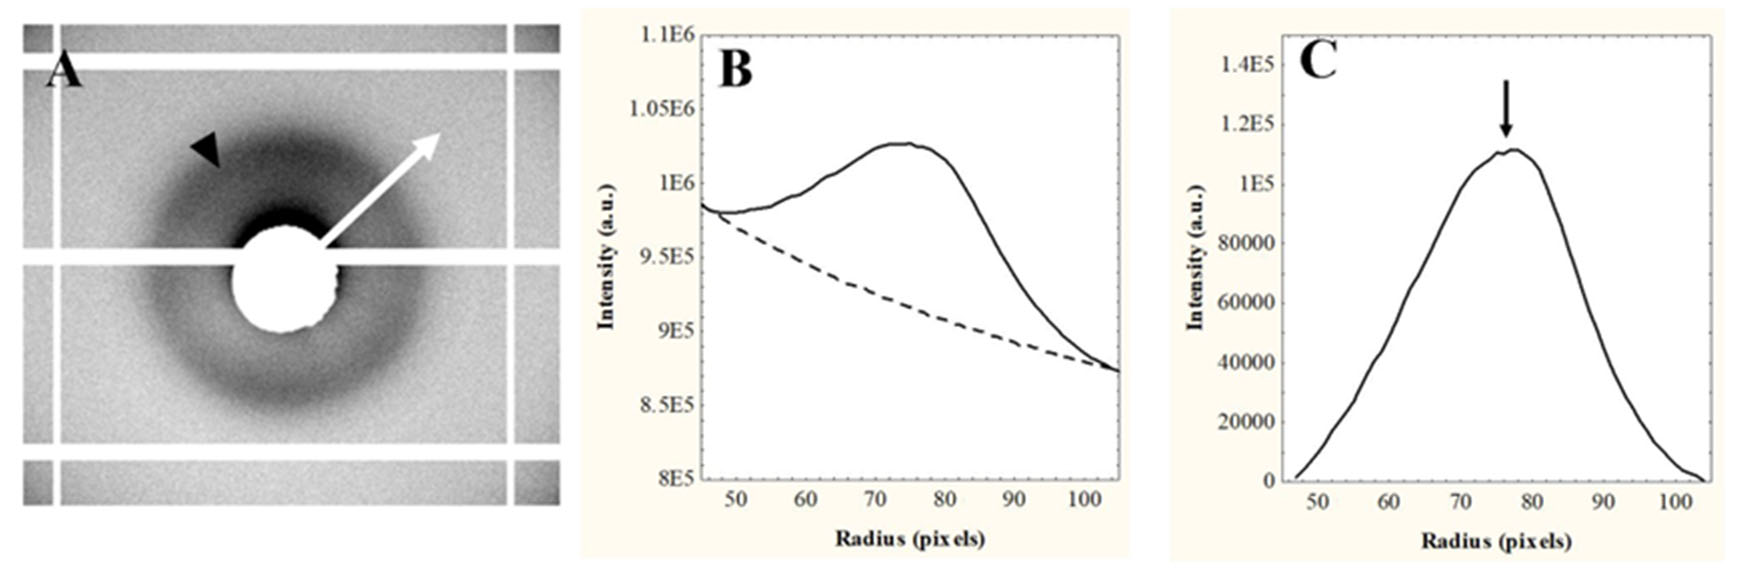
 Figure 2 of
Ma, Mol Vis 2026; 32:169-184.
Figure 2 of
Ma, Mol Vis 2026; 32:169-184.