Figure 5 of
Wang, Mol Vis 2026; 32:143-153.
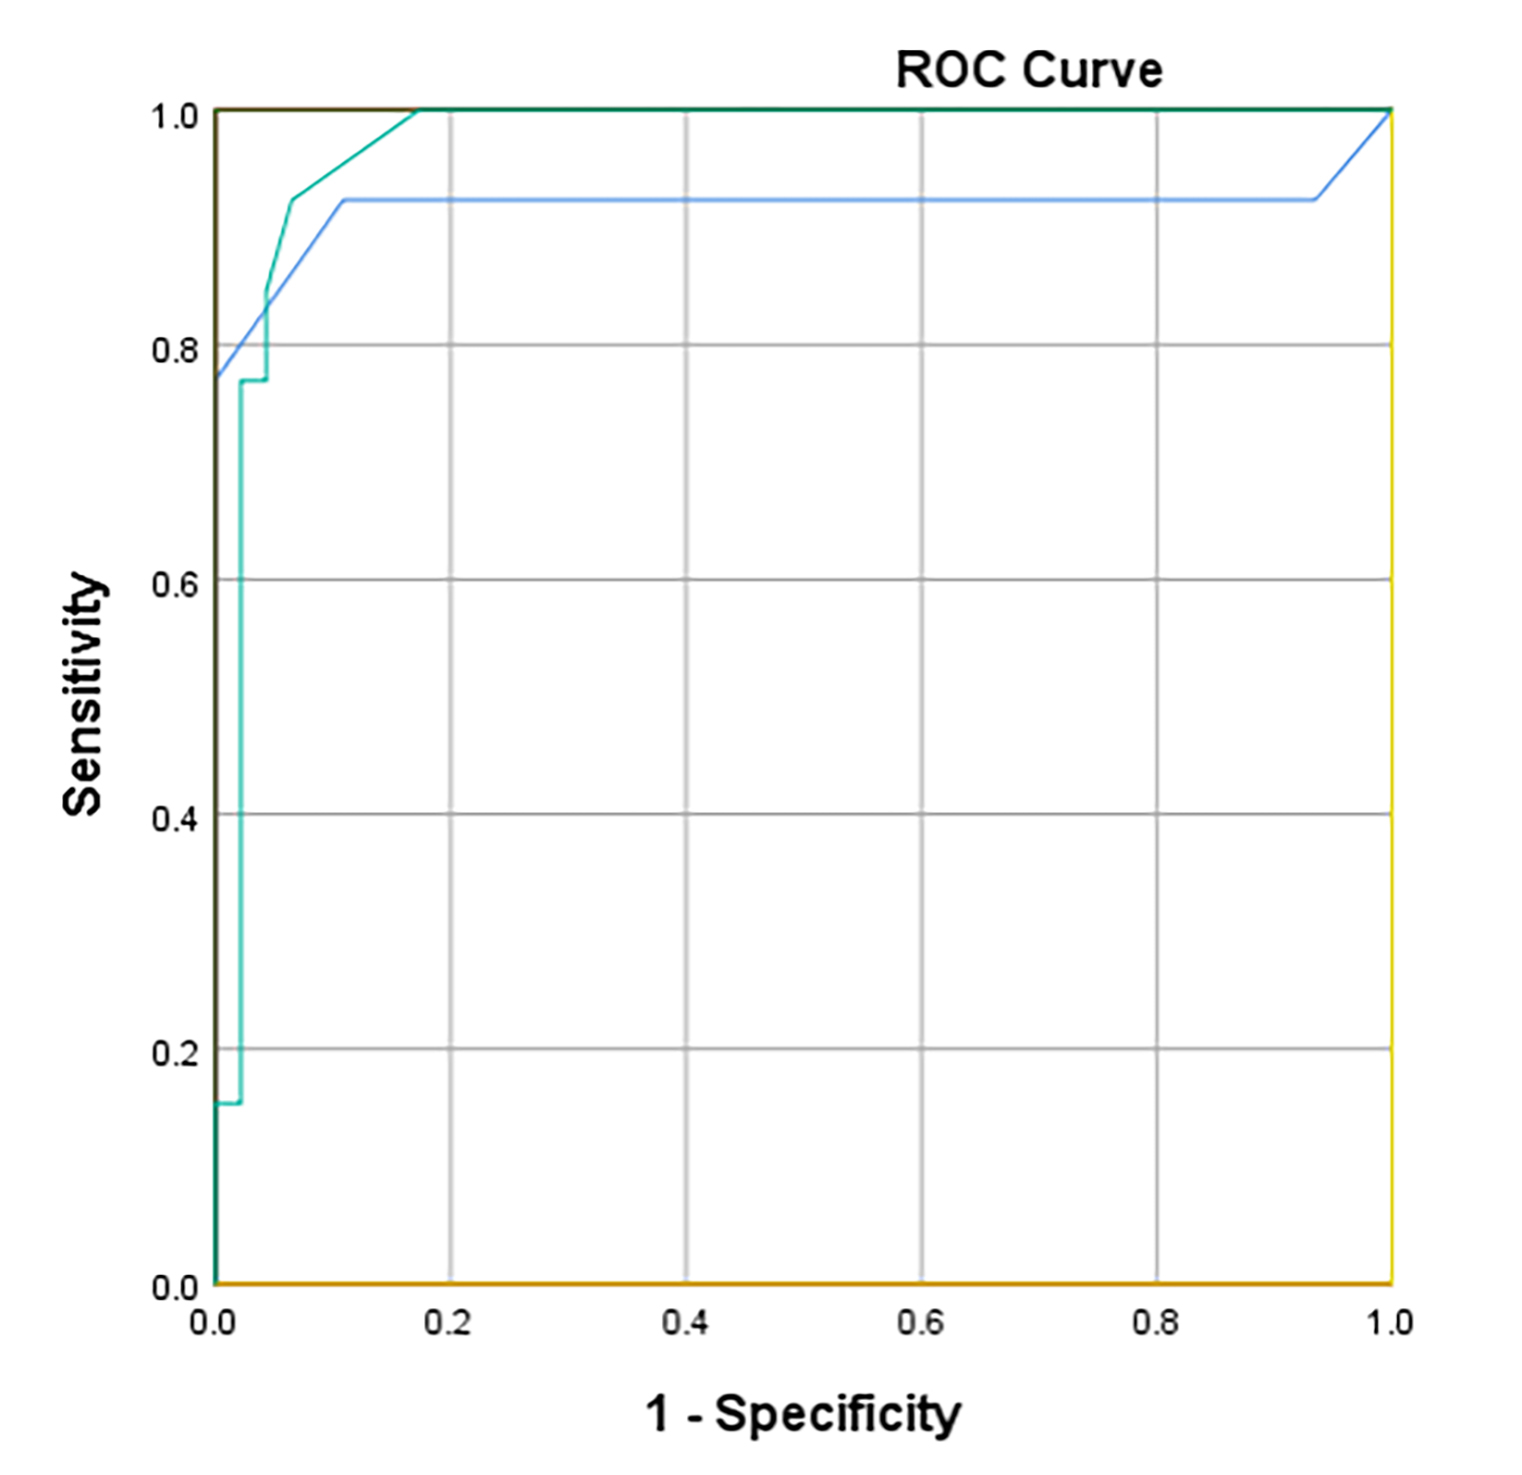
Figure 5.
S-I, SN-IT, Min, Max, and Min-Max between the clinical severe keratoconus group and the normal control group. SD value corresponds to ROC curve. Curve colors: S-I: blue; SN-IT: red; Min: orange; Max: cyan; Min-Max: yellow; SD: green.
 Figure 5 of
Wang, Mol Vis 2026; 32:143-153.
Figure 5 of
Wang, Mol Vis 2026; 32:143-153.