Figure 2 of
Wang, Mol Vis 2026; 32:143-153.
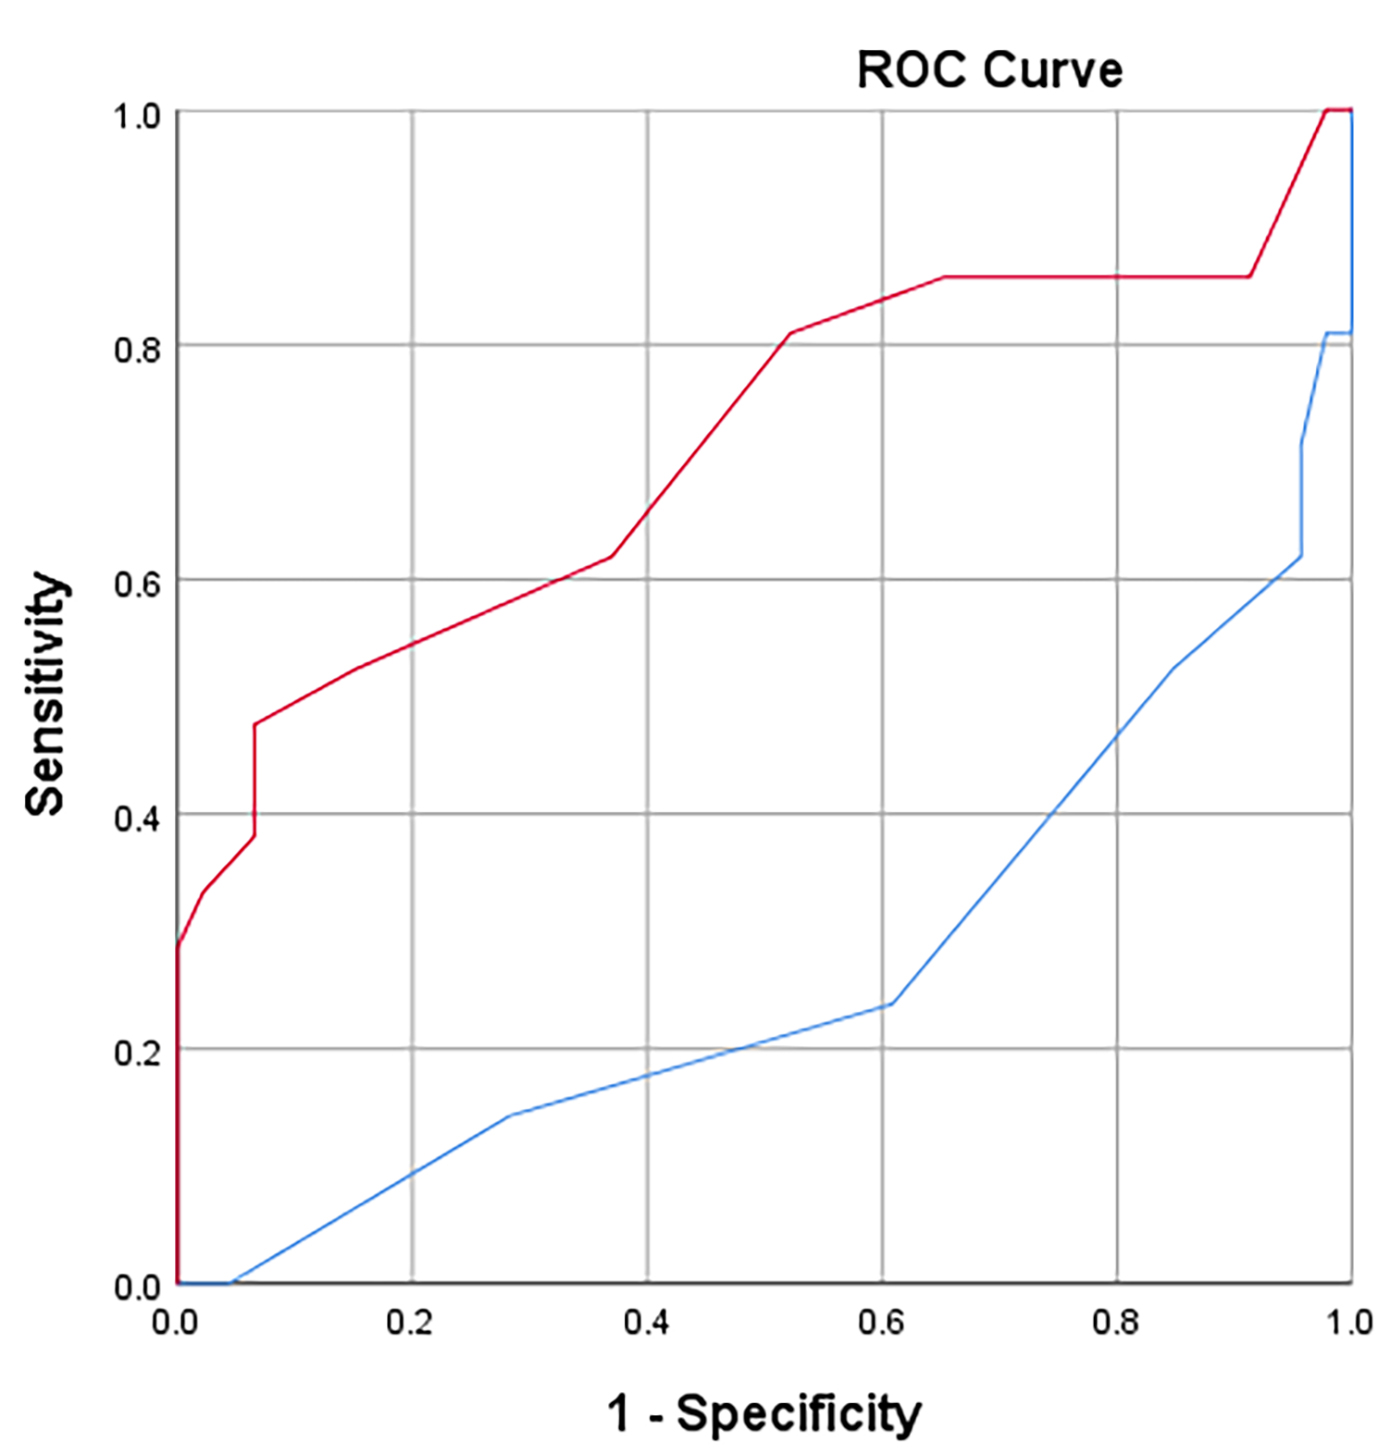
Figure 2.
Distinguishing Min-Max and SD between the preclinical keratoconus group and the normal control group. Dev value corresponds to the ROC curve. Curve colors: Min-Max: red; SD: blue.
 Figure 2 of
Wang, Mol Vis 2026; 32:143-153.
Figure 2 of
Wang, Mol Vis 2026; 32:143-153.