Figure 3. The number of RGC in six different inbred strains (129×1/SvJ, A/J, BALB/cByJ, C57BL/6J, CBA/CaJ, and CAST/EiJ) of mice is
shown in four bar graphs. Each bar represents the mean number with the standard error of the mean indicated by brackets. A displays the number of BRN3A-positive RGCs. The number of POU6F2- positive RGCs is shown in B. The total number of RGCs is shown in C and the total number of cells in the ganglion cell layer (GCL) is shown in D.
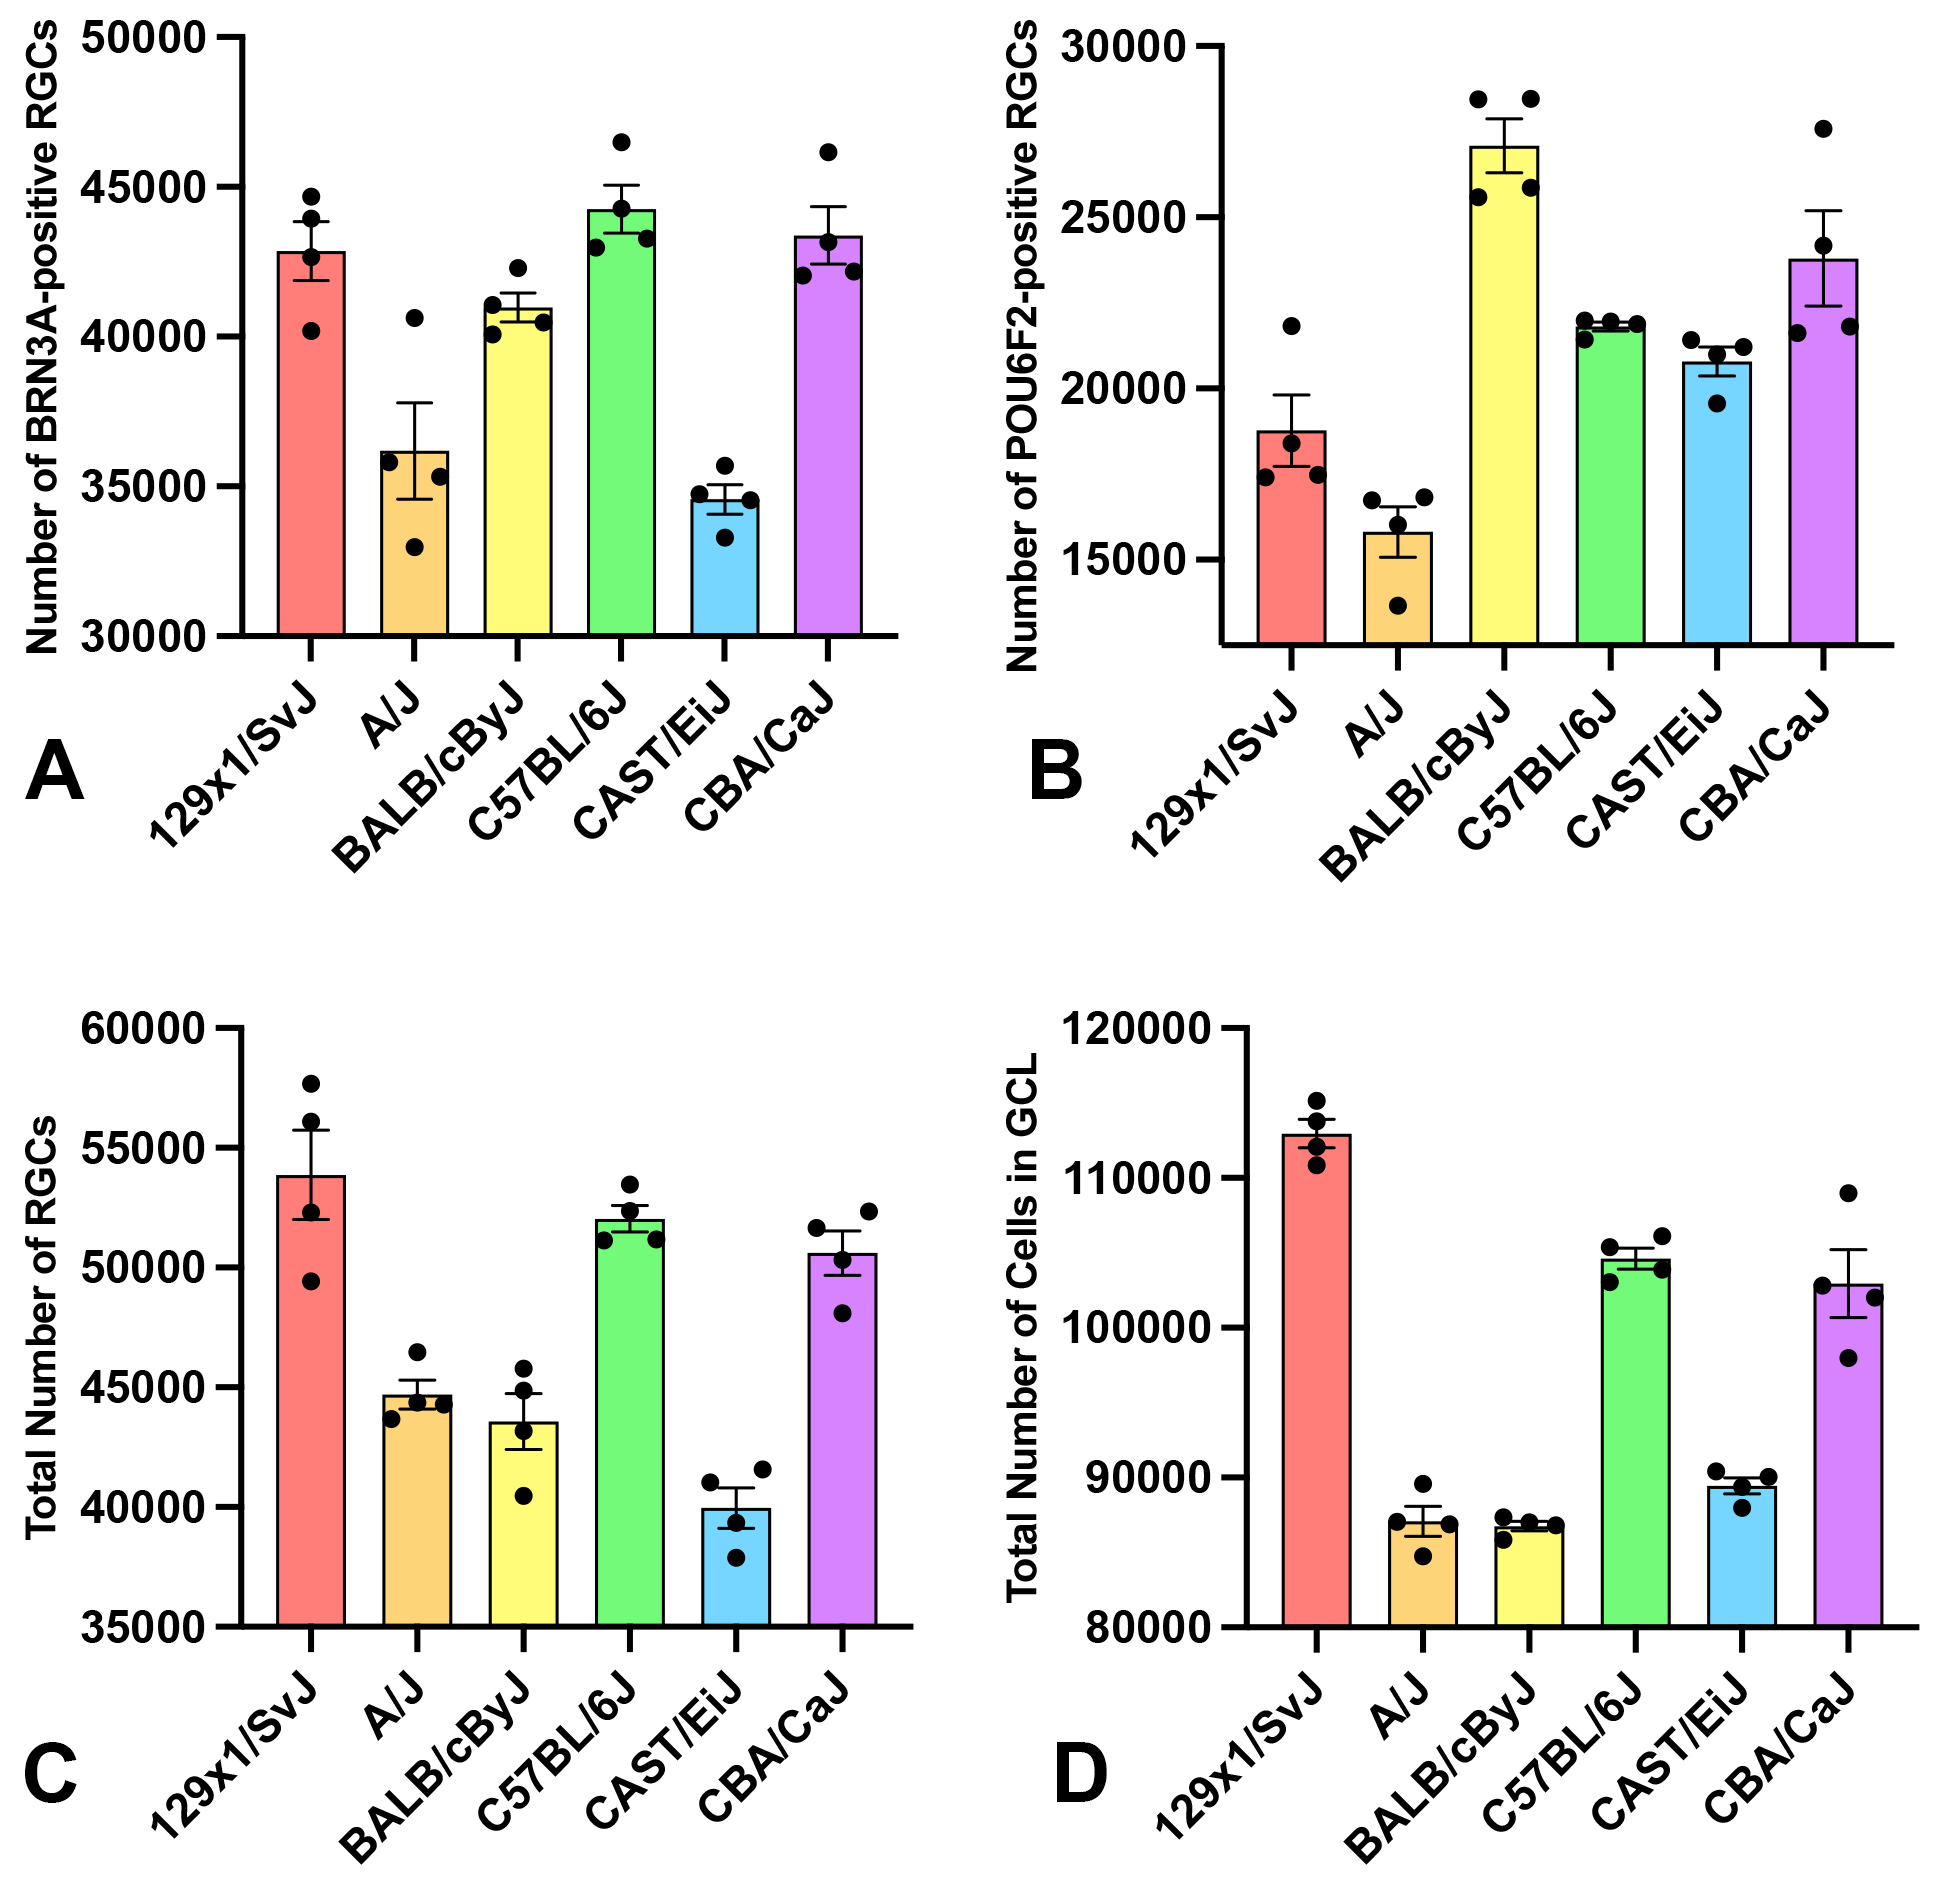
 Figure 3 of
Lin, Mol Vis 2026; 32:120-129.
Figure 3 of
Lin, Mol Vis 2026; 32:120-129.