Figure 1. The density of RGC subtypes varies across the surface of the retina. A is a retinal flat mountstained for BRN3A, POU6F2, and counterstained for TO-PRO-3. The density of the BRN3A-positive RGCs
across the retina is shown in B. The density of the POU6F2-positive RGCs is shown in C. The density of TO-PRO-3 positive nuclei is shown in D. E displays the distribution of total RGCs (a combination of BRN3A and POU6F2 staining). The density is shown as a heat map
with the color scale to the right of each image indicating cell number and matching color.
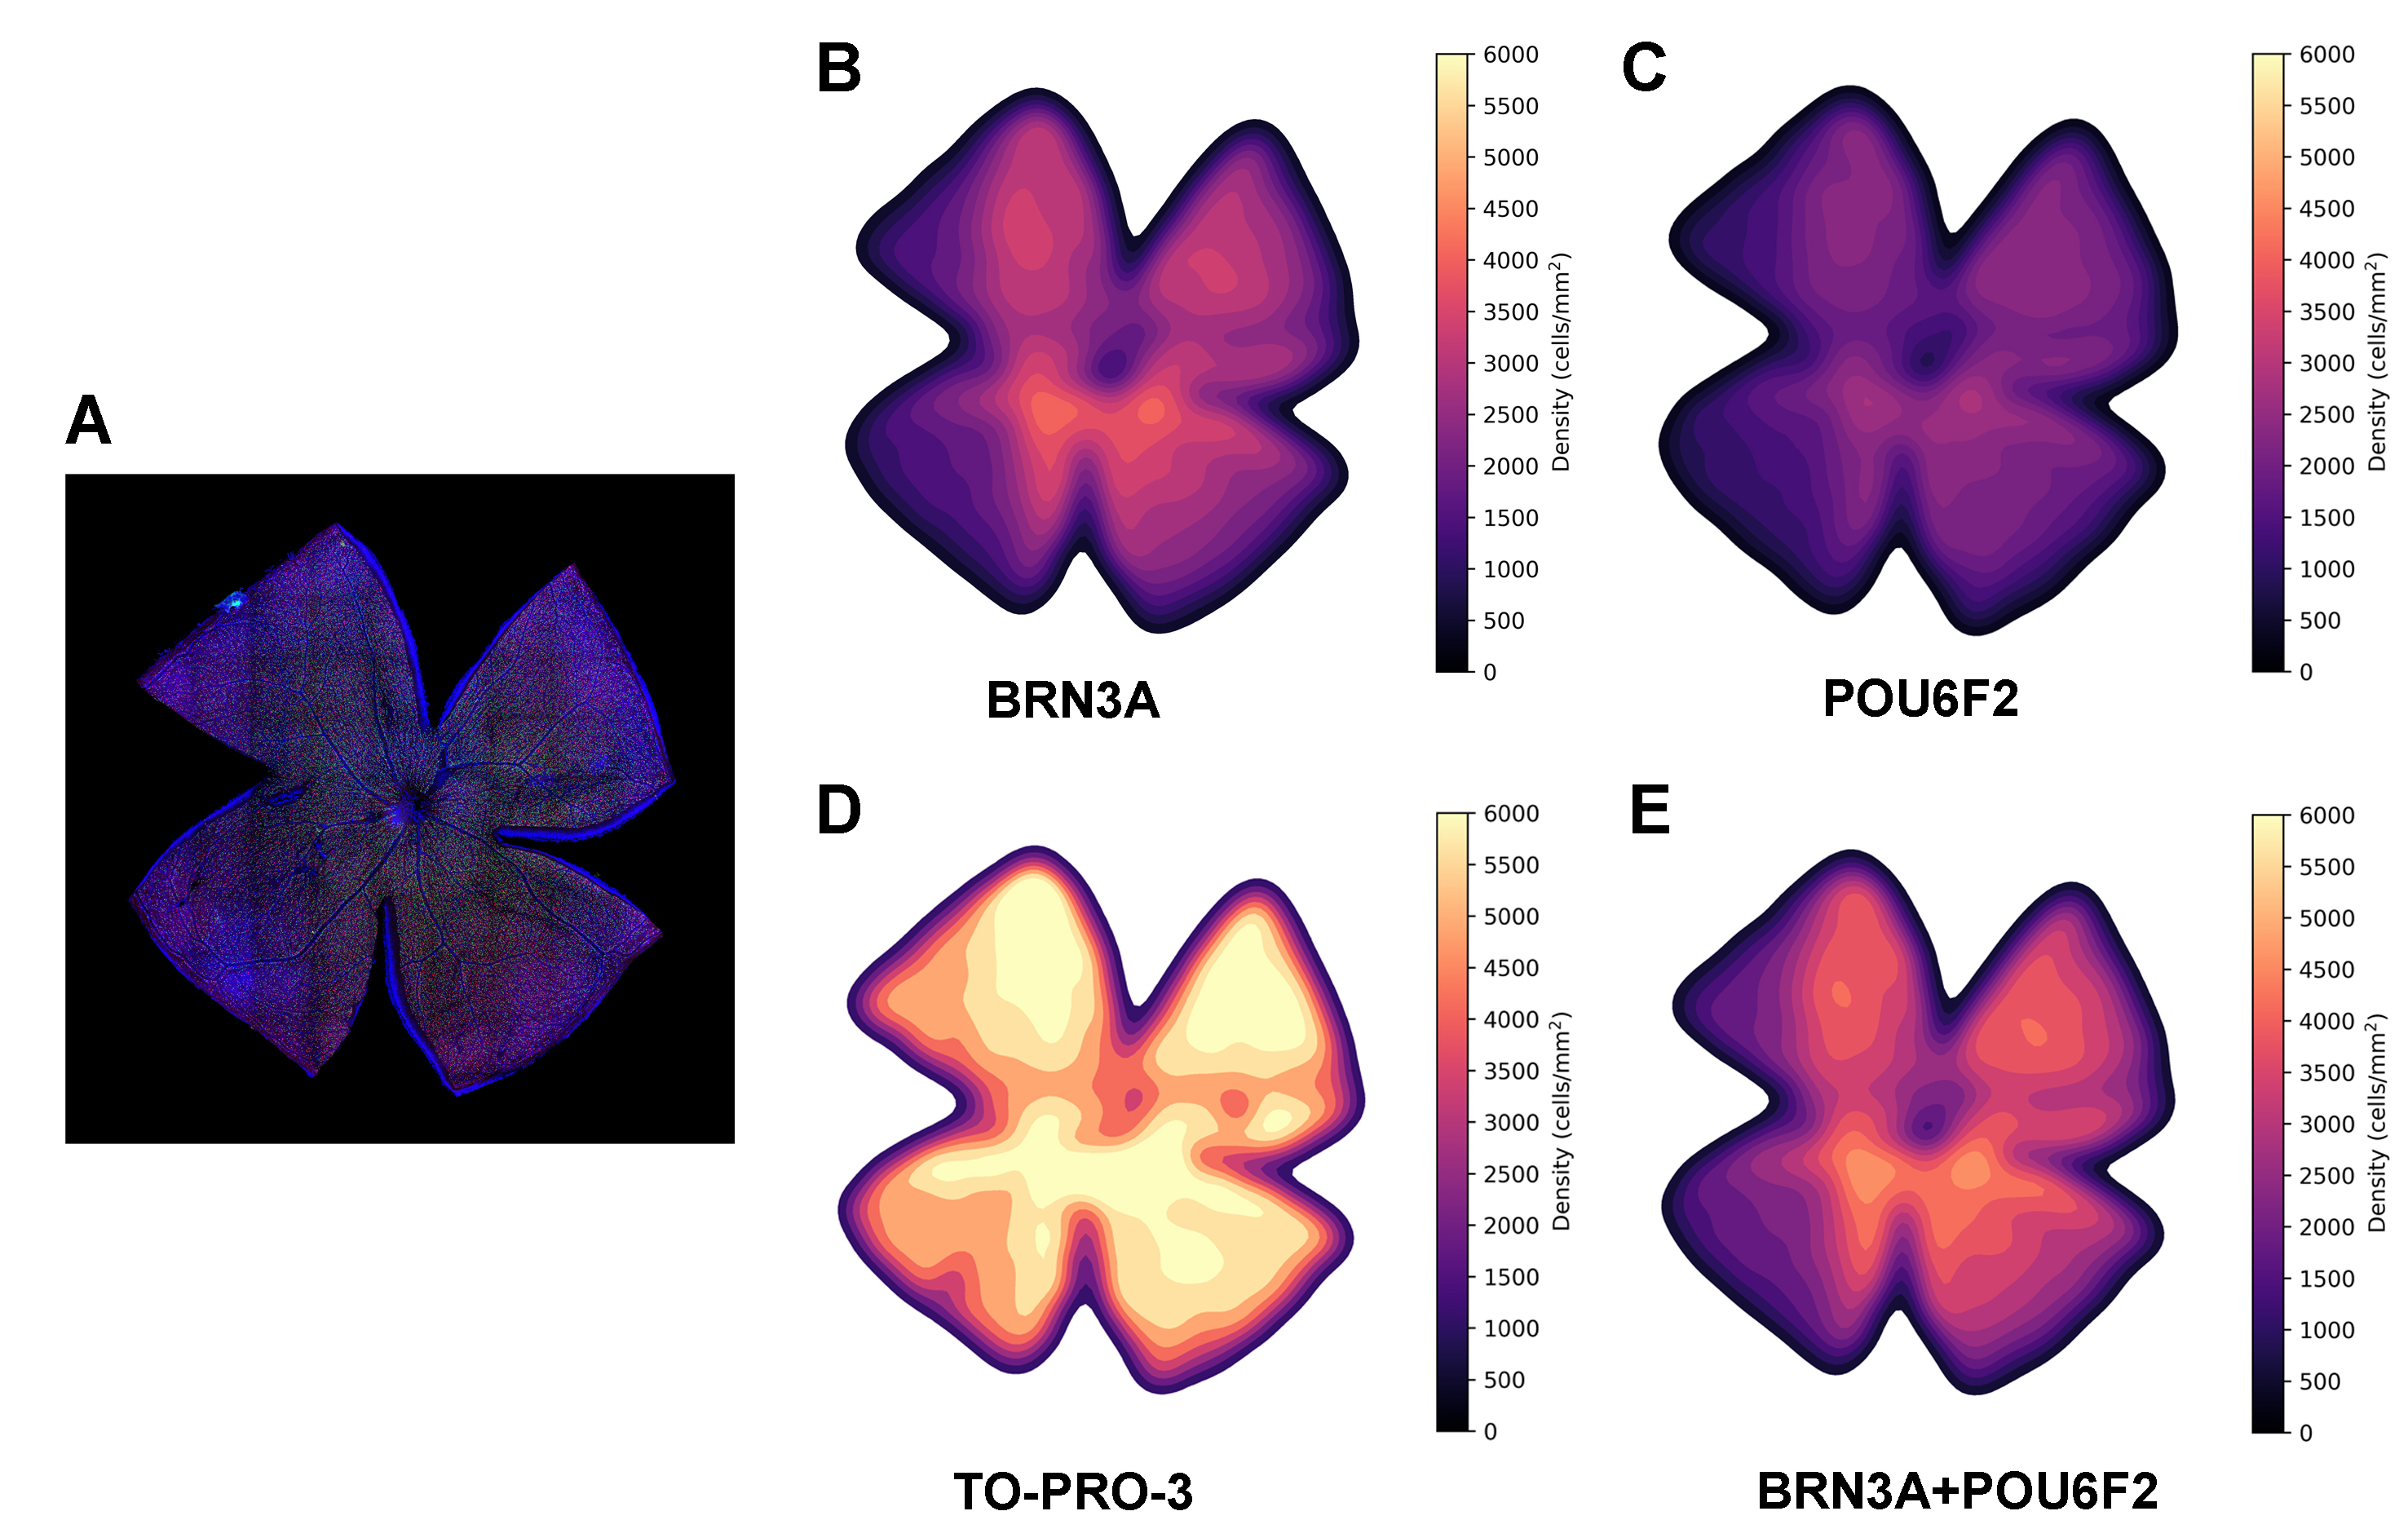
 Figure 1 of
Lin, Mol Vis 2026; 32:120-129.
Figure 1 of
Lin, Mol Vis 2026; 32:120-129.