Figure 6. Phenotypic evaluation of OPN1MW-driven AAVs in RhoP23H/+ mice. A-C: Fundus images, OCT scans (top rows), and immunofluorescence images (bottom rows) of RhoP23H/+ retinas subretinally injected with (A) AAV::OPN1MW-ctrl, (B) AAV::OPN1MW-shEgr1 and (C) AAV::OPN1MW-mEgr1 at 8 wpi. White arrows point to injection sites. OCT scans are color-coded in red when across the optic nerve or blue when
across the injection site. Immunofluorescence panels show the transduction pattern of the virus (GFP, except AAV-OPN1MW-mEgr1 as well as EGR1 and PNA-positive cells as grayscale images and the colored merge. Scale bars: 20 μm. (D) Left panel: example image of a cone arrestin (ARR3) staining in RhoP23H/+ mice. Right panel: bar graph reporting the number of ARR3-positive cells in a 600 μm-long section of the transduced and untransduced
retinal areas of RhoP23H/+ mice at 8 wpi of AAV::mOP-ctrl (red), AAV::mOP-shEgr1 (blue), and AAV::mOP-mEgr1 (green). Shown are individual values and means ± SD. Two-way ANOVA with Šídák's multiple comparisons test. n=3–4. ONL: outer
nuclear layer; INL: inner nuclear layer; GCL: ganglion cell layer.
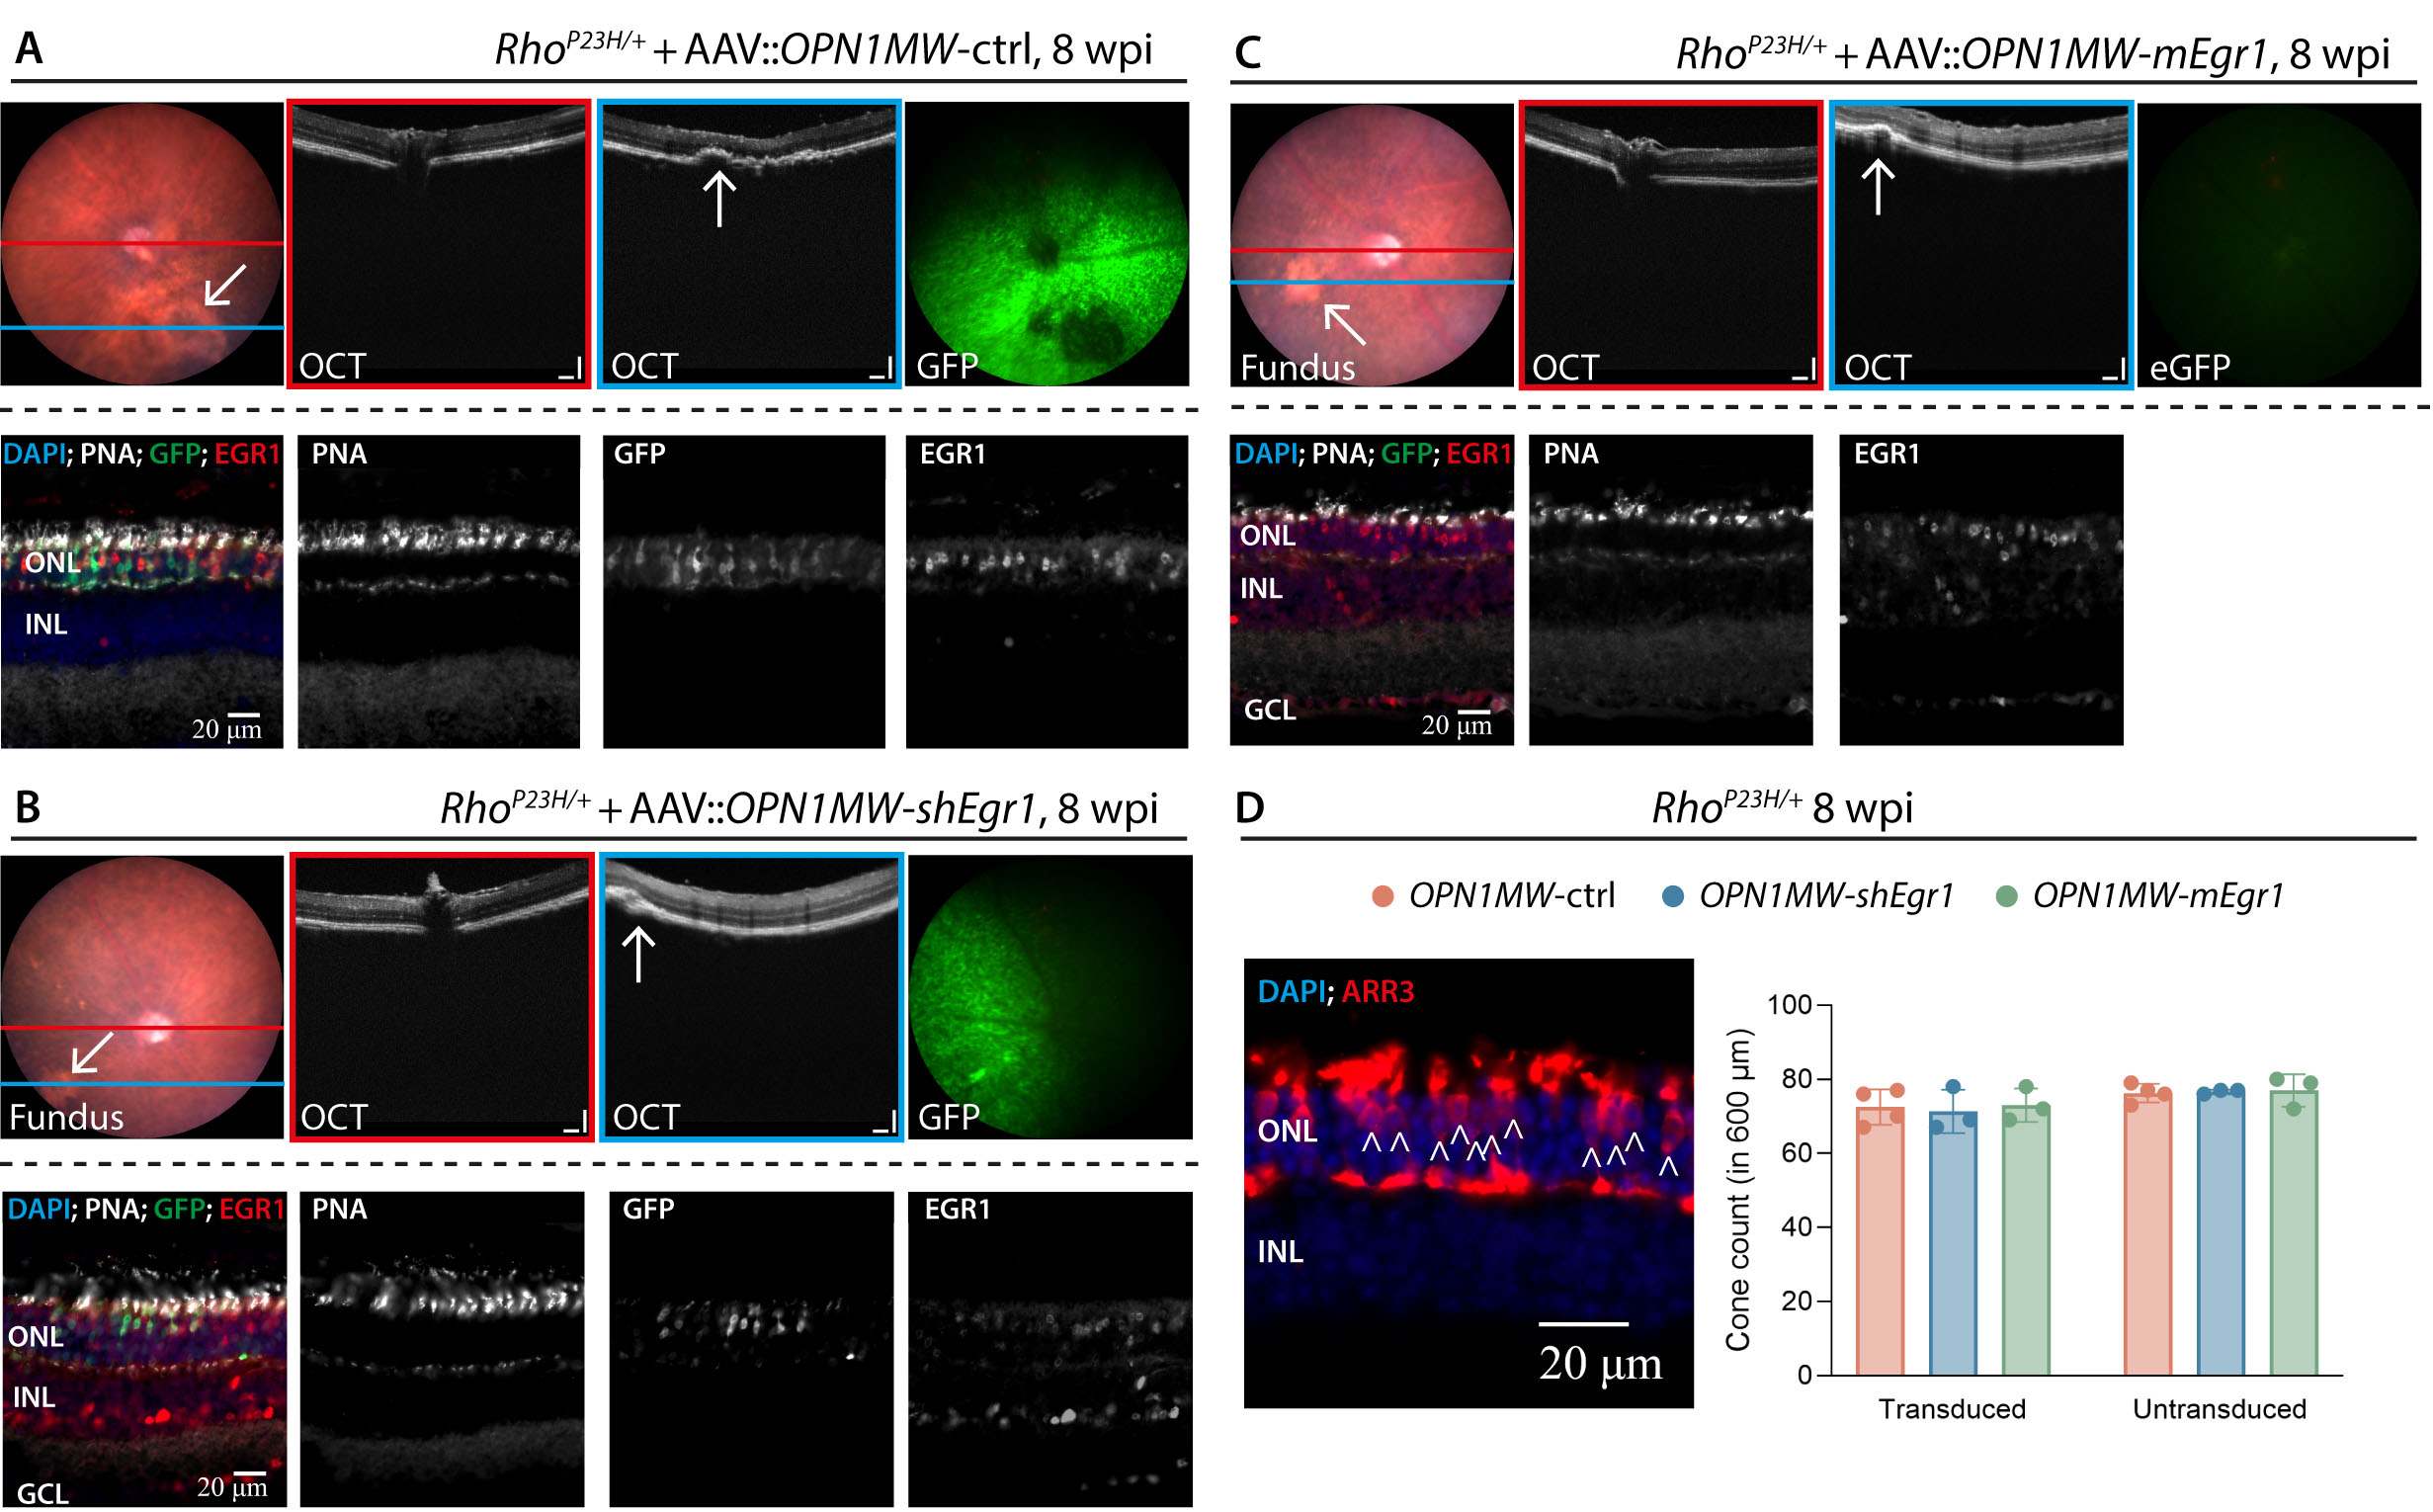
 Figure 6 of
Merolla, Mol Vis 2026; 32:102-118.
Figure 6 of
Merolla, Mol Vis 2026; 32:102-118.