Figure 4. Phenotypic evaluation of mOP-driven AAVs in RhoP23H/+ mice. A: Immunofluorescence images of RhoP23H/+ retinas injected with AAV::mOP-ctrl (Ctrl), AAV::mOP-shEgr1 (shEgr1), and AAV::mOP-mEgr1 (mEgr1) at 12 wpi. Individual panels show the transduction pattern of the virus (GFP) as well as EGR1 and rhodopsin (RHO) positive
cells as grayscale images and the colored merge. Scale bars: 20 μm. (B) Fundus images and OCT scans of RhoP23H/+ retinas injected with AAV::mOP-ctrl (Ctrl), AAV::mOP-shEgr1 (shEgr1), and AAV::mOP-mEgr1 (mEgr1) at 12 wpi. White arrows point to injection sites; OCT scans are color-coded in red when across the optic nerve or blue when
across the injection site. (C) Left panels: spidergrams of the ONL thickness of RhoP23H/+ mice injected with mOP-ctrl (red), mOP-shEgr1 (blue), or mOP-mEgr1 (green) at 4, 8 and 12 wpi. Measurements were taken every 200 µm from the optic nerve head (0 µm). Shown are means and range
of n=4–9. Right panels: quantification of the ONL thickness of the nasal (transduced) retina after AAV injections. Data points
show the average ONL thickness of all retinas at ten positions (400 µm to 2200 µm; 200 µm intervals) in the nasal retina.
Shown are means ± SD. One-way ANOVA with Tukey’s multiple comparisons test, p values as indicated. D) Same samples as in (C) but analyzed differently to reflect the progression of degeneration for each type of AAV throughout
time. The data points represent the averages of all measurements taken in the nasal ONL for each individual sample; thus,
each point on the bar graph corresponds to one retina analyzed. Two-way ANOVA with Tukey’s multiple comparisons test, p values
as indicated. n=4–9. ONL: outer nuclear layer; INL: inner nuclear layer; GCL: ganglion cell layer.
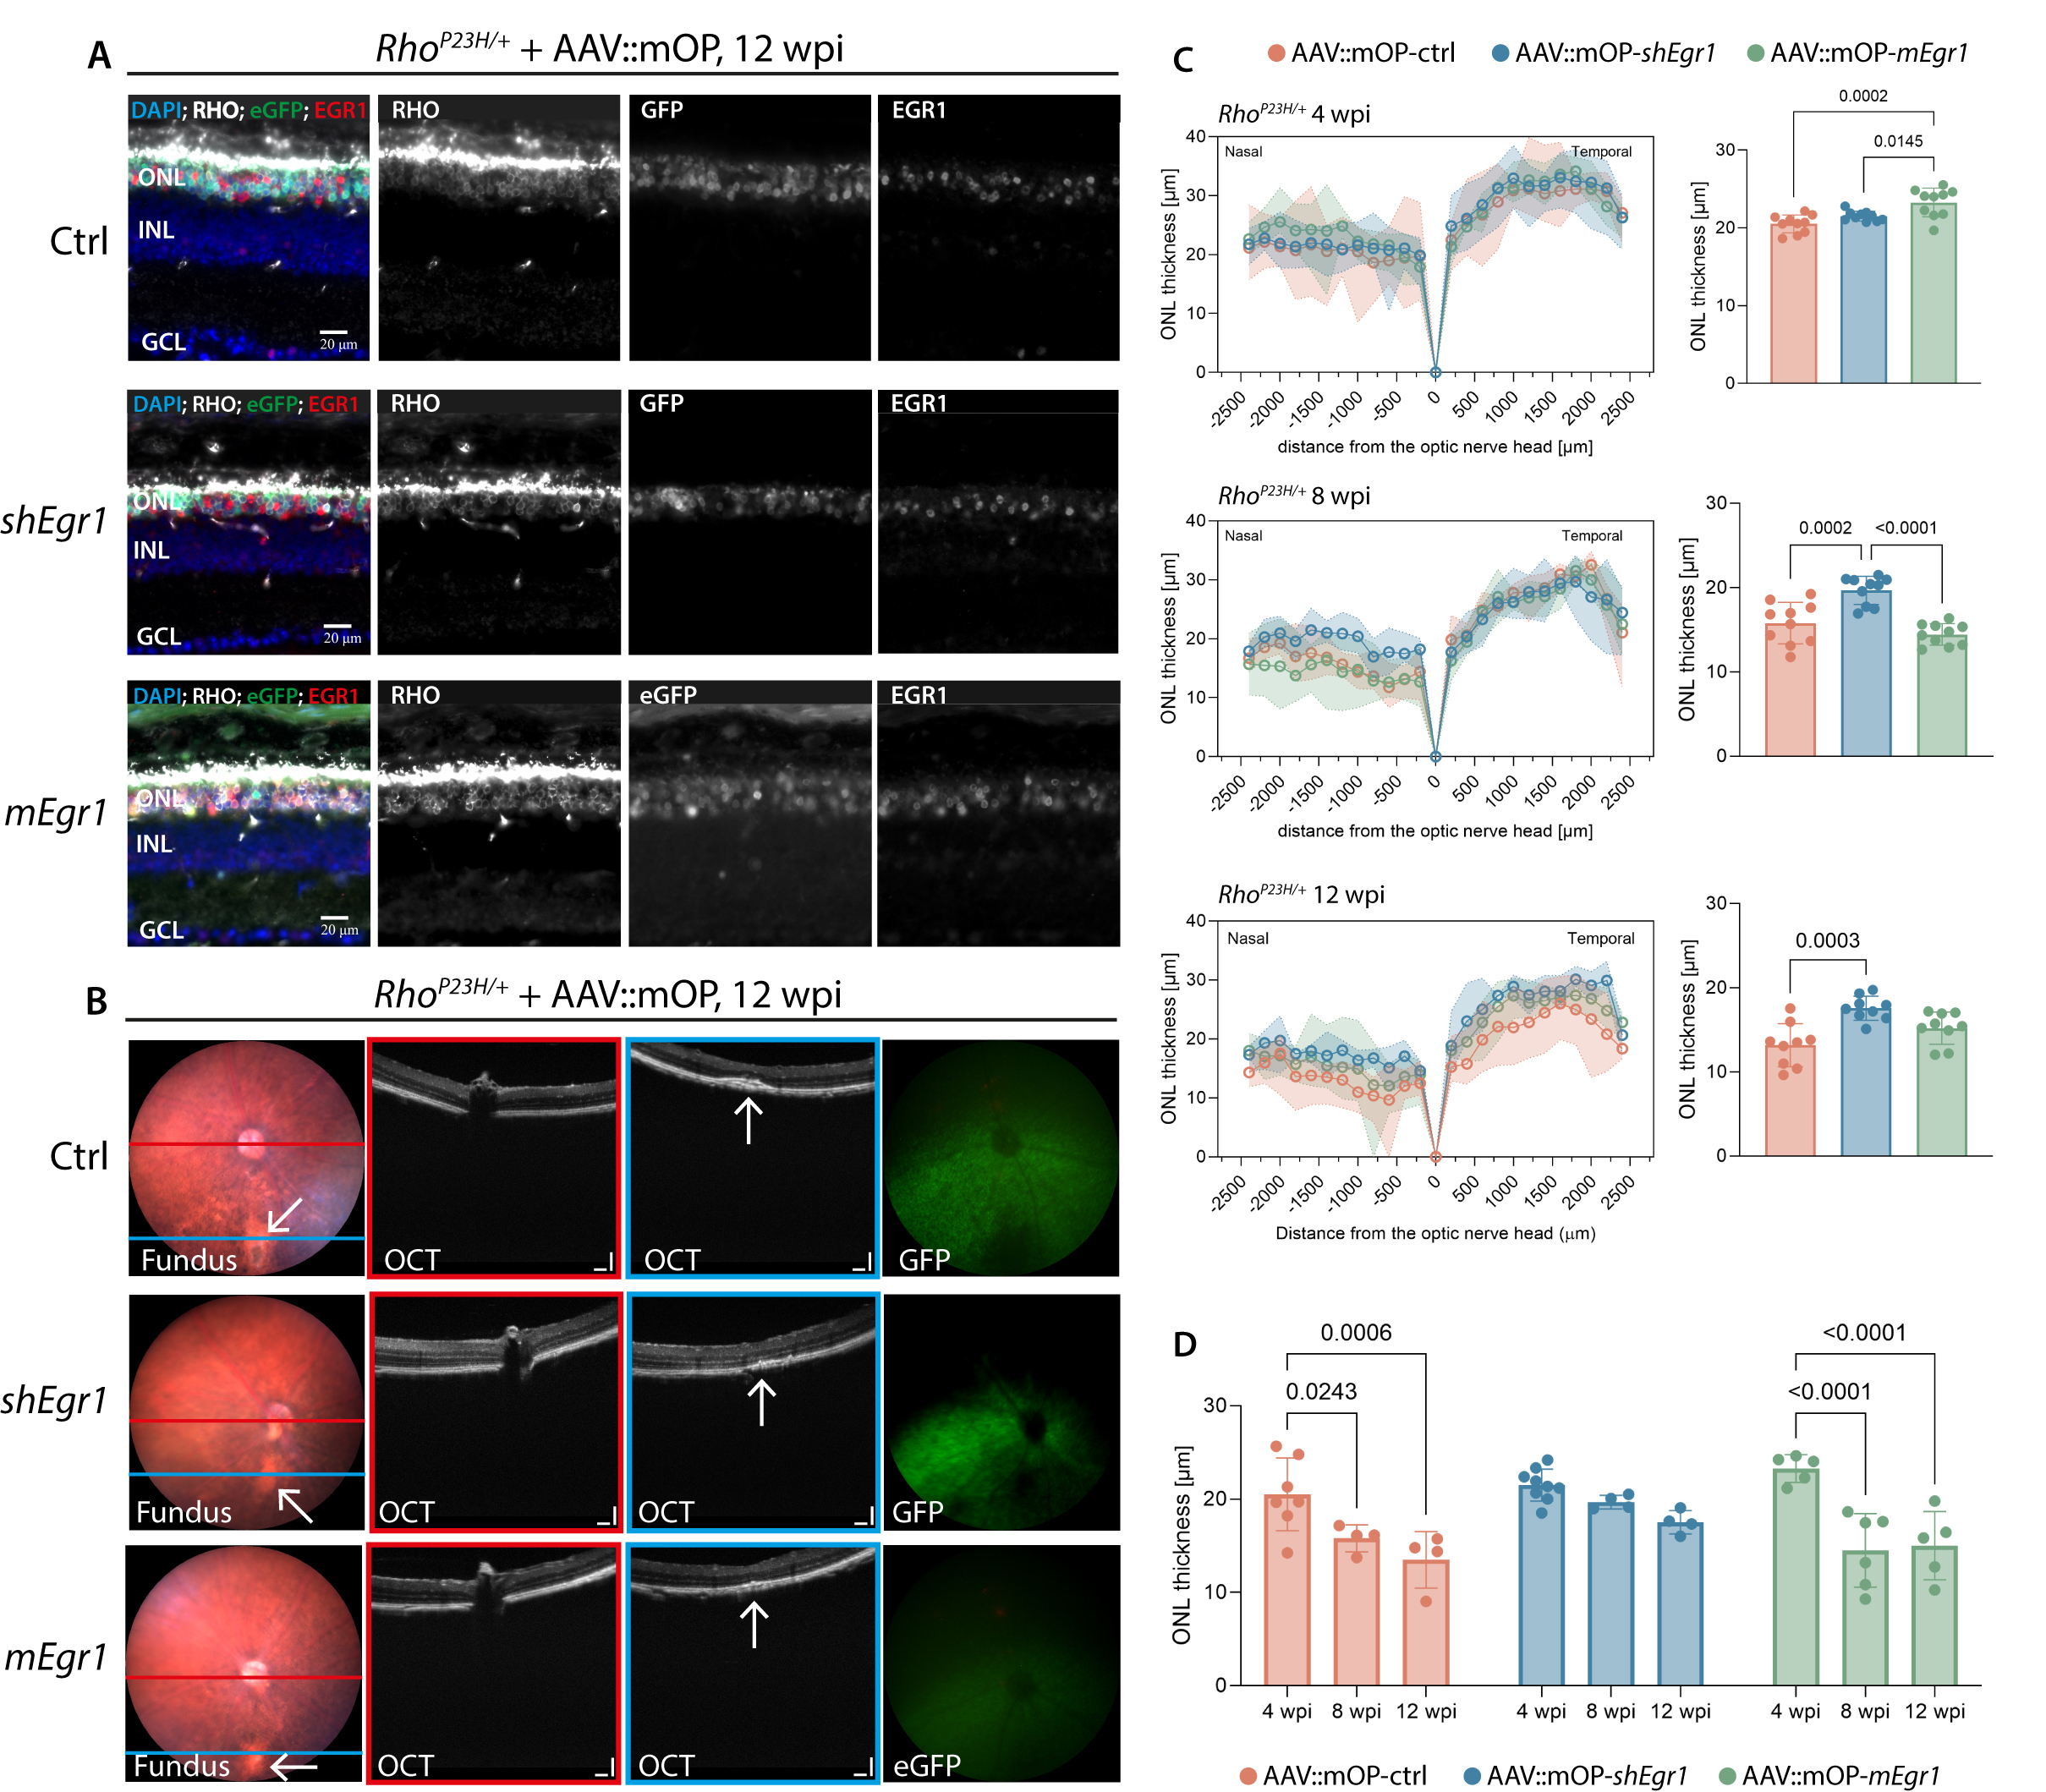
 Figure 4 of
Merolla, Mol Vis 2026; 32:102-118.
Figure 4 of
Merolla, Mol Vis 2026; 32:102-118.