Figure 1. EGR1 expression in RhoP23H/+ mice and after light damage. A: Immunofluorescence staining of EGR1 (red) in retinal sections from 8, 12, 16-week-old wild-type and RhoP23H/+ mice. DAPI (blue) was used to visualize cell nuclei. Scale bar: 50 μm. B: Real-time qPCR of retinal Egr1 expression in the model of light-induced degeneration. Levels are expressed relative to non-exposed dark controls (ctrl),
which were set to 1. Shown are individual data points and means ± SD n=3. One-way ANOVA with Dunnett’s multiple comparisons
test, p value as indicated. C, D: Immunofluorescence staining of retinal sections from 8-week-old RhoP23H/+ mice for RHO and EGR1 (C) and OPN1SW and EGR1 (D), showing EGR1 expression in degenerating rods and cones. White arrows point to RHO (C) or OPN1SW (D) positive cells expressing
EGR1. Scale bar: 20 μm. ONL: outer nuclear layer; INL: inner nuclear layer; GCL: ganglion cell layer; LD: light damage.
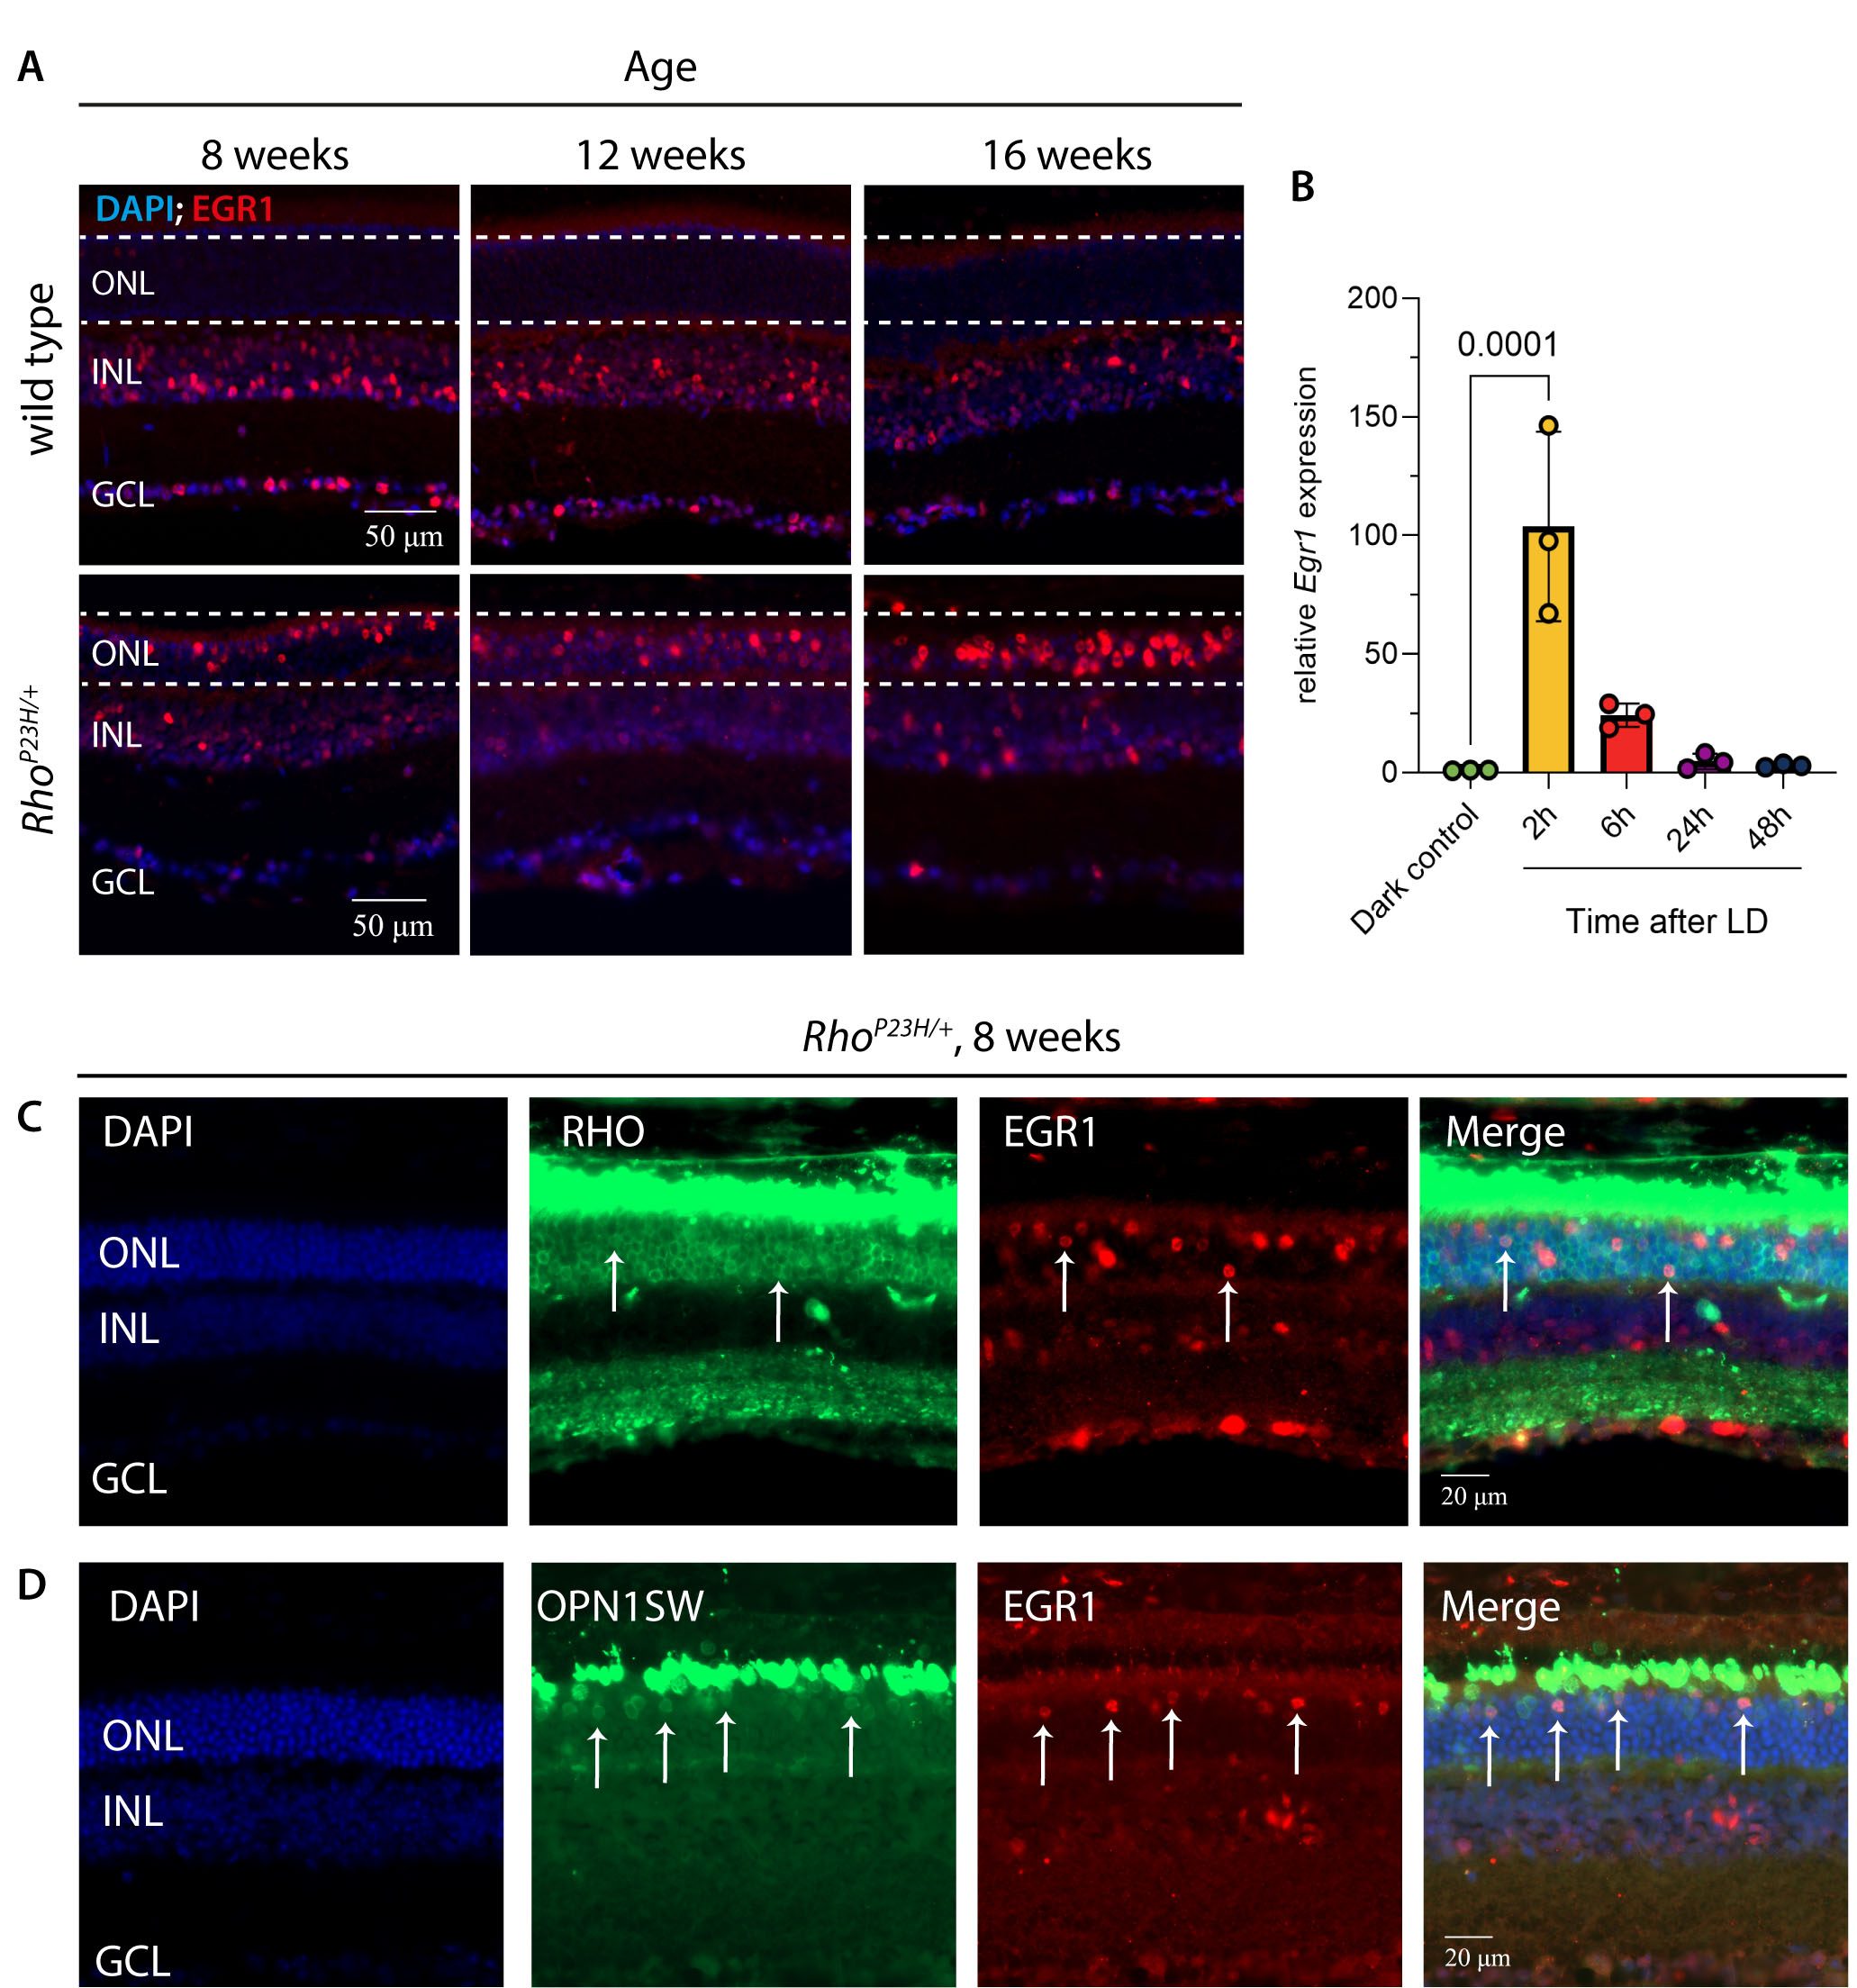
 Figure 1 of
Merolla, Mol Vis 2026; 32:102-118.
Figure 1 of
Merolla, Mol Vis 2026; 32:102-118.