Figure 4. AS-IV improves visual function in TON model rats. Typical graphs of F-VEP of rats in all groups; mean ± standard deviation
(n = 9); *p < 0.05 or **p < 0.01, compared with the MO group (excluding the CC group); #p < 0.05 or ##p < 0.01, comparison between all drug groups.
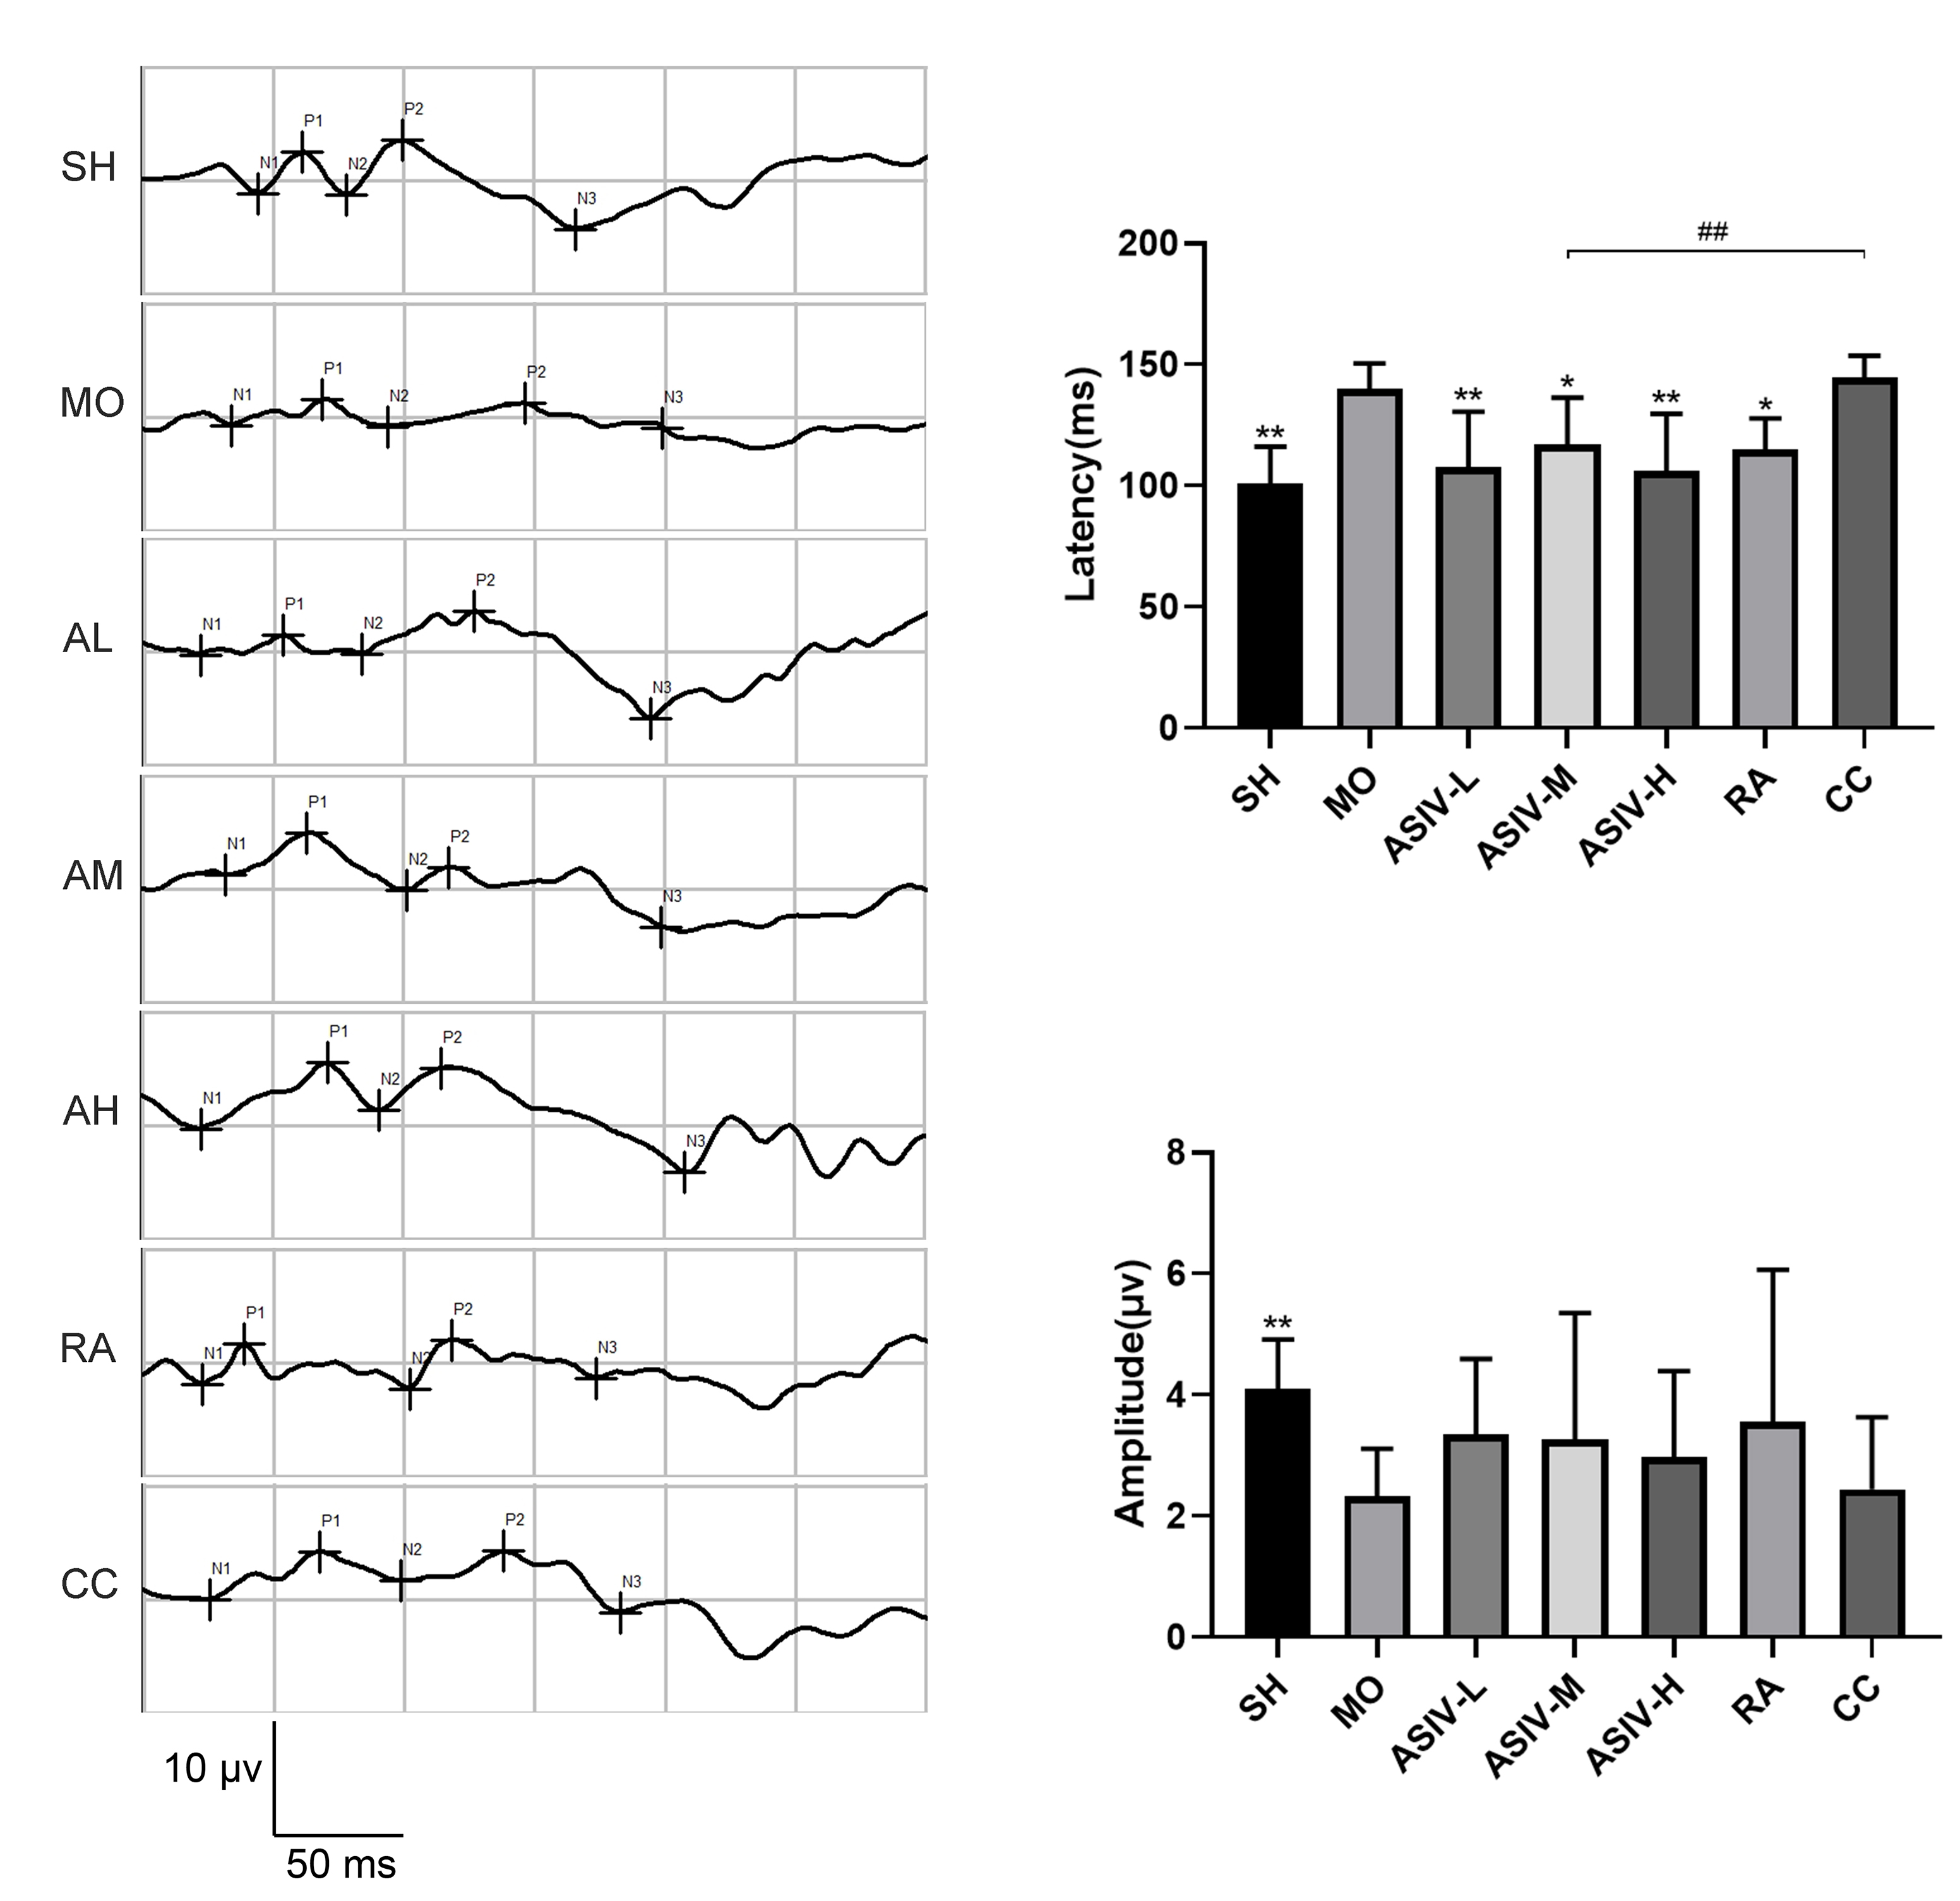
 Figure 4 of
Sun, Mol Vis 2025; 31:99-112.
Figure 4 of
Sun, Mol Vis 2025; 31:99-112.