Figure 1. Autophagy occurs in the optic nerve lateral retraction model. A: Hematoxylin and eosin staining was used to observe the retinal tissue in the SH (sham operation) group and the MO (model)
group. GCL, ganglion cell layer; INL, inner nuclear layer; ONL, outer nuclear layer. B: The changes in F-VEP in the SH and MO groups (n = 9). Mean ± standard deviation; **p < 0.01. C: Immunofluorescence staining was used to assess LC3 protein in the retinal tissues of the SH and MO groups. D: The retinal tissue of rats was observed under a transmission electron microscope. a, Normal retinal ultrastructure; b, retinal
ultrastructure after 7 days in the model group, bar = 5 μm; b1, partially enlarged image b, bar = 2 μm. The arrow refers to
the autophagosome.
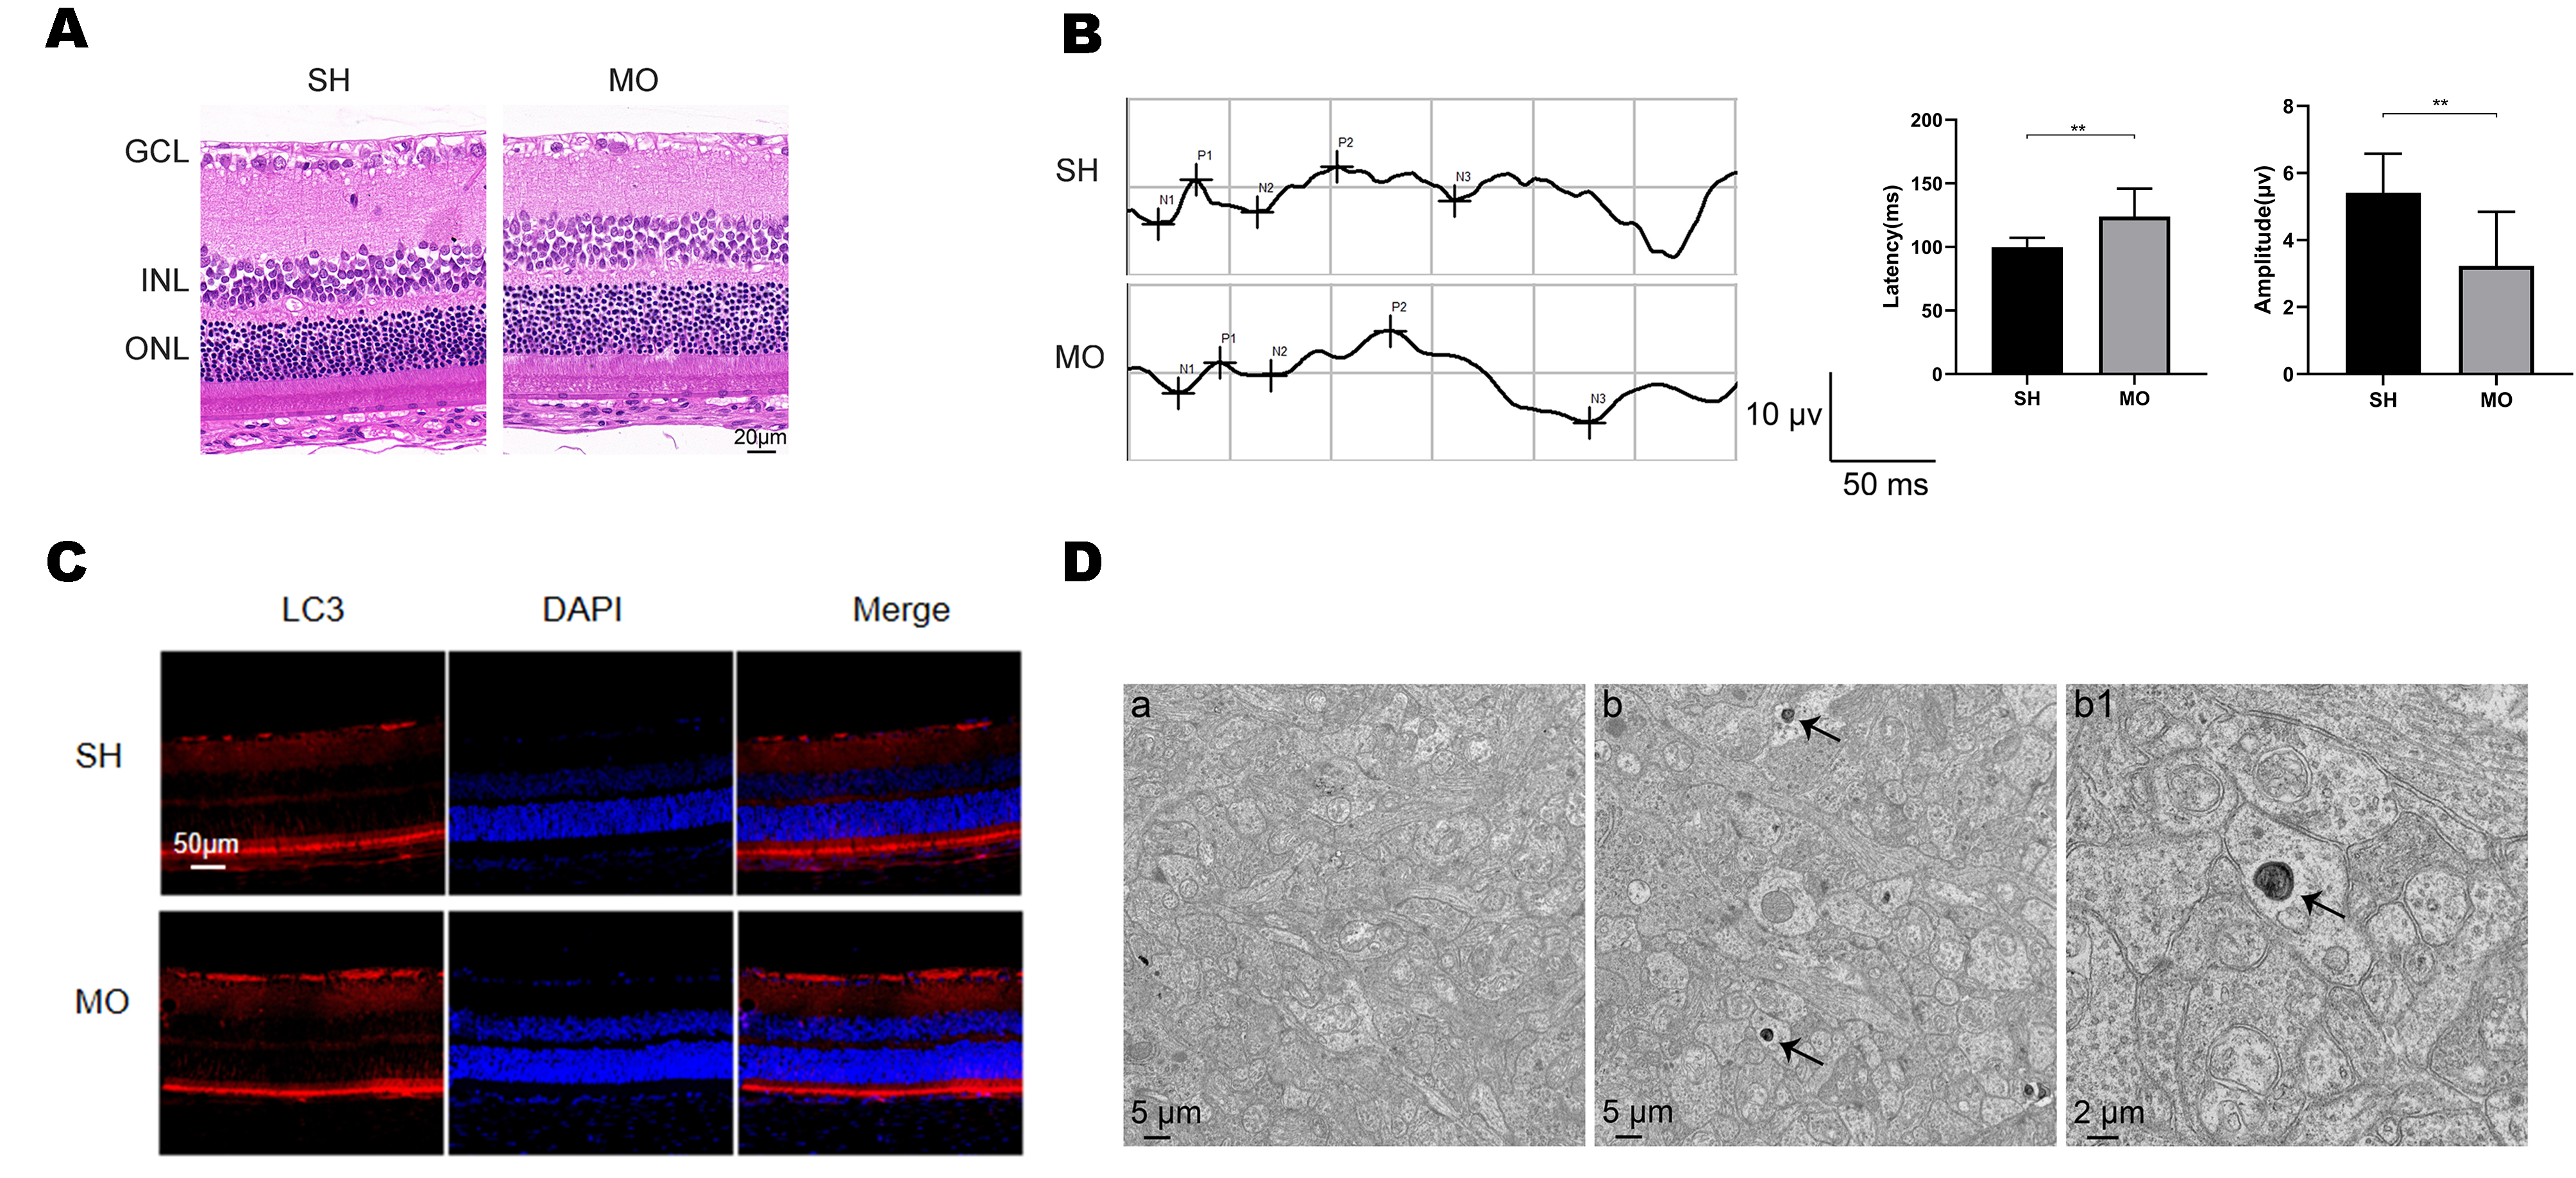
 Figure 1 of
Sun, Mol Vis 2025; 31:99-112.
Figure 1 of
Sun, Mol Vis 2025; 31:99-112.