Figure 8. NCOA2 as a transcriptional coactivator induces positive feedback regulation of STAT5/EFNA1. A. HRMECs and HUVECs were overexpressed with EFNA1 and transfected with siRNA-NCOA2. Quantitative real-time PCR was used to
detect the mRNA expression levels of EFNA1 and NCOA2. B. WB experiment was used to detect the protein expression levels of EFNA1 and NCOA2. C. Vascular endothelial cells were treated with IL-15 for 48 h, and NCOA2 expression was knocked down. WB experiment was used
to detect the protein expression level of EFNA1. D. Co-immunoprecipitation experiment was used to validate the interaction between STAT5 and NCOA2. E. ChIP experiment was used to validate the binding relationship between STAT5 protein and the EFNA1 gene. F. CCK8 was used to detect the cell proliferation rate of vascular endothelial cells cultured for 0, 12, 24, and 48 h. G. EdU staining was used to assess cell proliferation ability. H, I. The cell wound-healing assay was used to detect cell migration ability. J. The angiogenesis assay was used to detect tubule formation ability. *p < 0.05, **p < 0.01, ***p < 0.001 versus Con. #p < 0.05, ##p < 0.01, ###p < 0.001 versus IL-15. n = 3. Statistical significance was determined by using one-way analysis of variance for more than
two groups. Subsequently, Dunnett’s post hoc tests were conducted. p < 0.05 was considered significant.
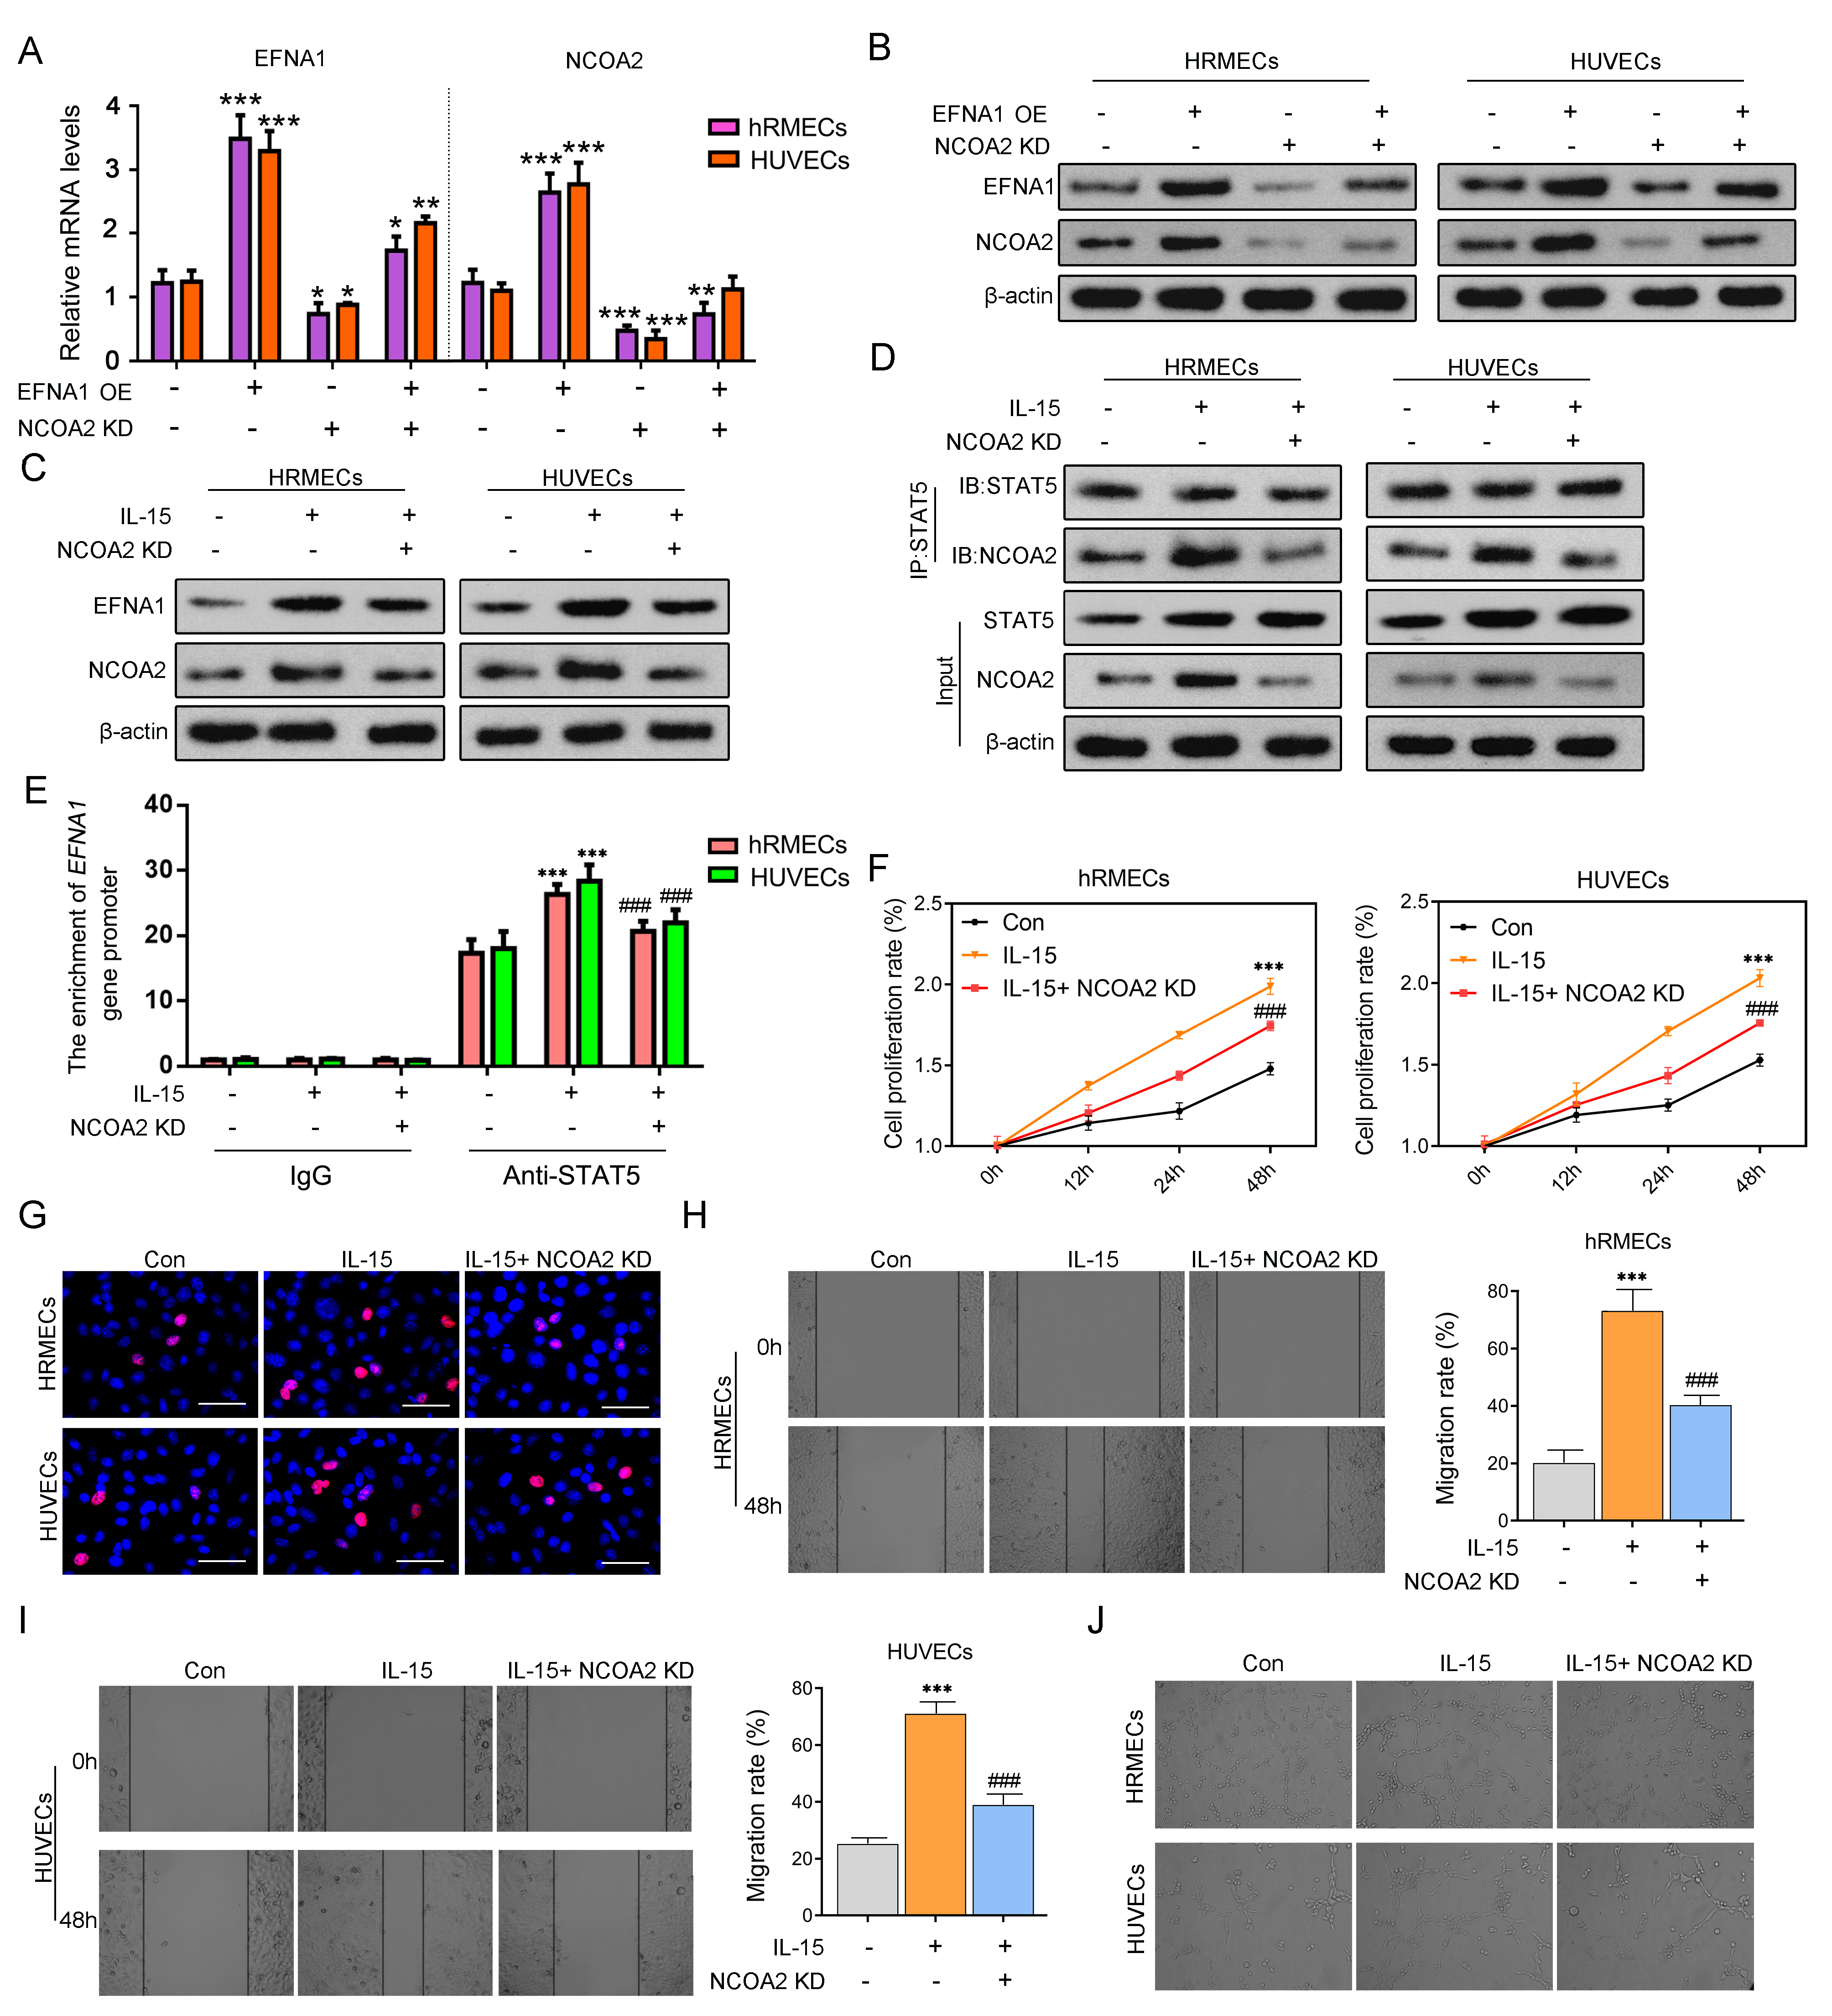
 Figure 8 of
Zhang, Mol Vis 2025; 31:597-616.
Figure 8 of
Zhang, Mol Vis 2025; 31:597-616.