Figure 3. High expression of IL-15 in DR. A. The expression of IL-15 in blood PBMCs was detected by quantitative real-time PCR (n = 20). B. The expression of IL-15 in
blood PBMCs was detected by western blot assay (n = 20). The western blot pictures show nine representative samples in each
group. C. The enrichment levels of T lymphocyte marker CD4, pan-B lymphocyte marker CD19, and monocyte/macrophage marker
CD163 were quantitatively detected by flow cytometry. The number represents a percentage of the total cell count. D. Quantitative real-time PCR was used to detect IL-15 mRNA expression levels of three kinds of cells in PBMCs in patients
with DR (n = 20). E. A cell line of monocytes/macrophages (THP-1) was used in this study in vitro. THP-1 cells were treated with 5, 10, 20, 25, and 30 mmol/l glucose solution, and IL-15 mRNA expression levels were detected
by quantitative real-time PCR (n = 3). F,G. THP-1 cells were stimulated with 5 nM (Con) and 25 nM (HG) glucose solutions, and IL-15 expression levels were detected
by western blot and enzyme-linked immunosorbent assay (n = 3). *p < 0.05, **p < 0.01, ***p < 0.001. Statistical significance was determined by using an unpaired Student t test for two groups or one-way analysis of variance for more than two groups. Subsequently, Dunnett’s post hoc tests were
conducted. p < 0.05 was considered significant.
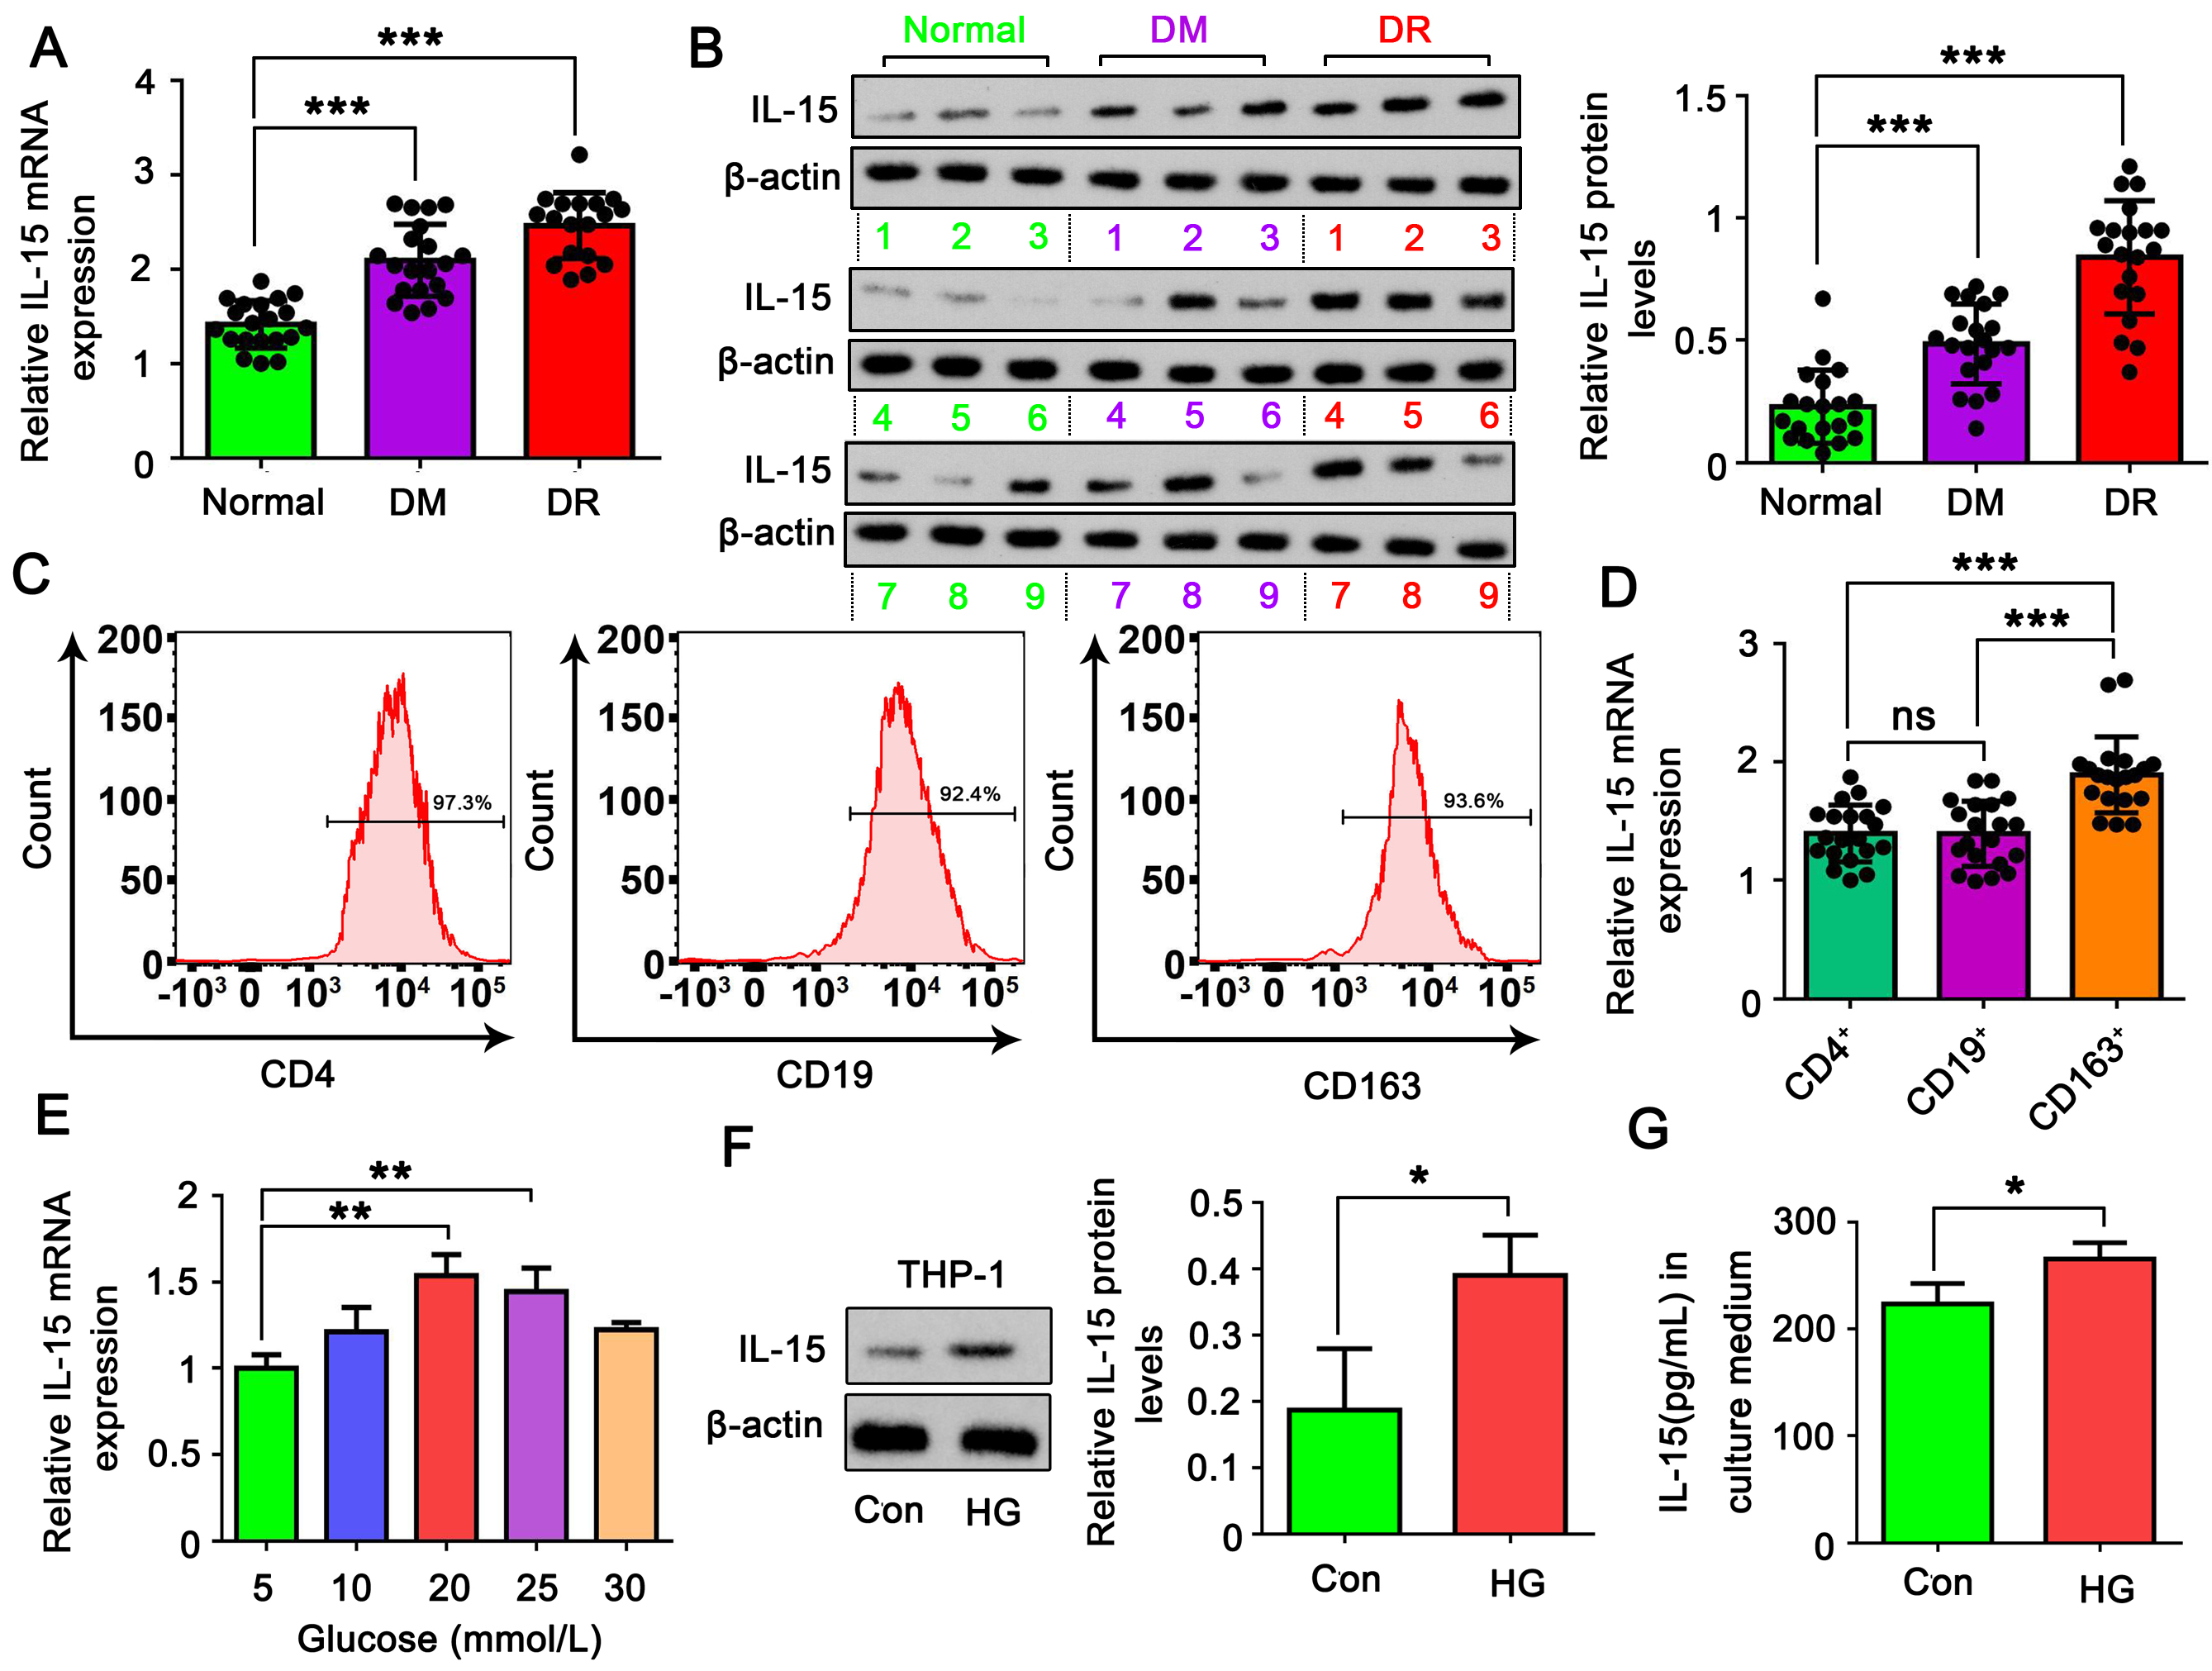
 Figure 3 of
Zhang, Mol Vis 2025; 31:597-616.
Figure 3 of
Zhang, Mol Vis 2025; 31:597-616.