Figure 2. Cell cluster identification and related gene screening. A. Uniform manifold approximation and projection (UMAP) plot representing the five cell types identified through the analysis
of single-cell RNA-seq data from four DR tissue samples in the GSE245561 data set, with data preprocessing following the literature
method (nFeature_RNA >500; percent_mito <25) for clustering identification. B. Dot plot of common cell-specific markers. C. UMAP plot of EFNA1 expression across the five cell types. D. Violin plot of EFNA1 expression across the five cell types. E. Heatmaps of differentially expressed genes between high and low EFNA1 expression groups. FindMarkers were used for intergroup
differential gene analysis, and thresholds were set to screen for differentially expressed genes, including a minimum percentage
threshold of >0.3 in both groups, an absolute value of average log2 fold change of >0.3, and a p value of <0.01. F. The violin chart was divided into four groups according to the expression level of EFNA1. The horizontal bars in the box
represent the median. The top and bottom of the box represent the 25th and 75th percentiles, and the lines extend into a 1.5×
quartile range. G. Gene volcano map of EFNA1 low expression group and EFNA1 high expression group. H,I. Correlation analysis of significantly differentially expressed genes with EFNA1 was performed to screen out the top five
genes with positive and negative correlation ≥0.3 and p value <0.05 with EFNA1.
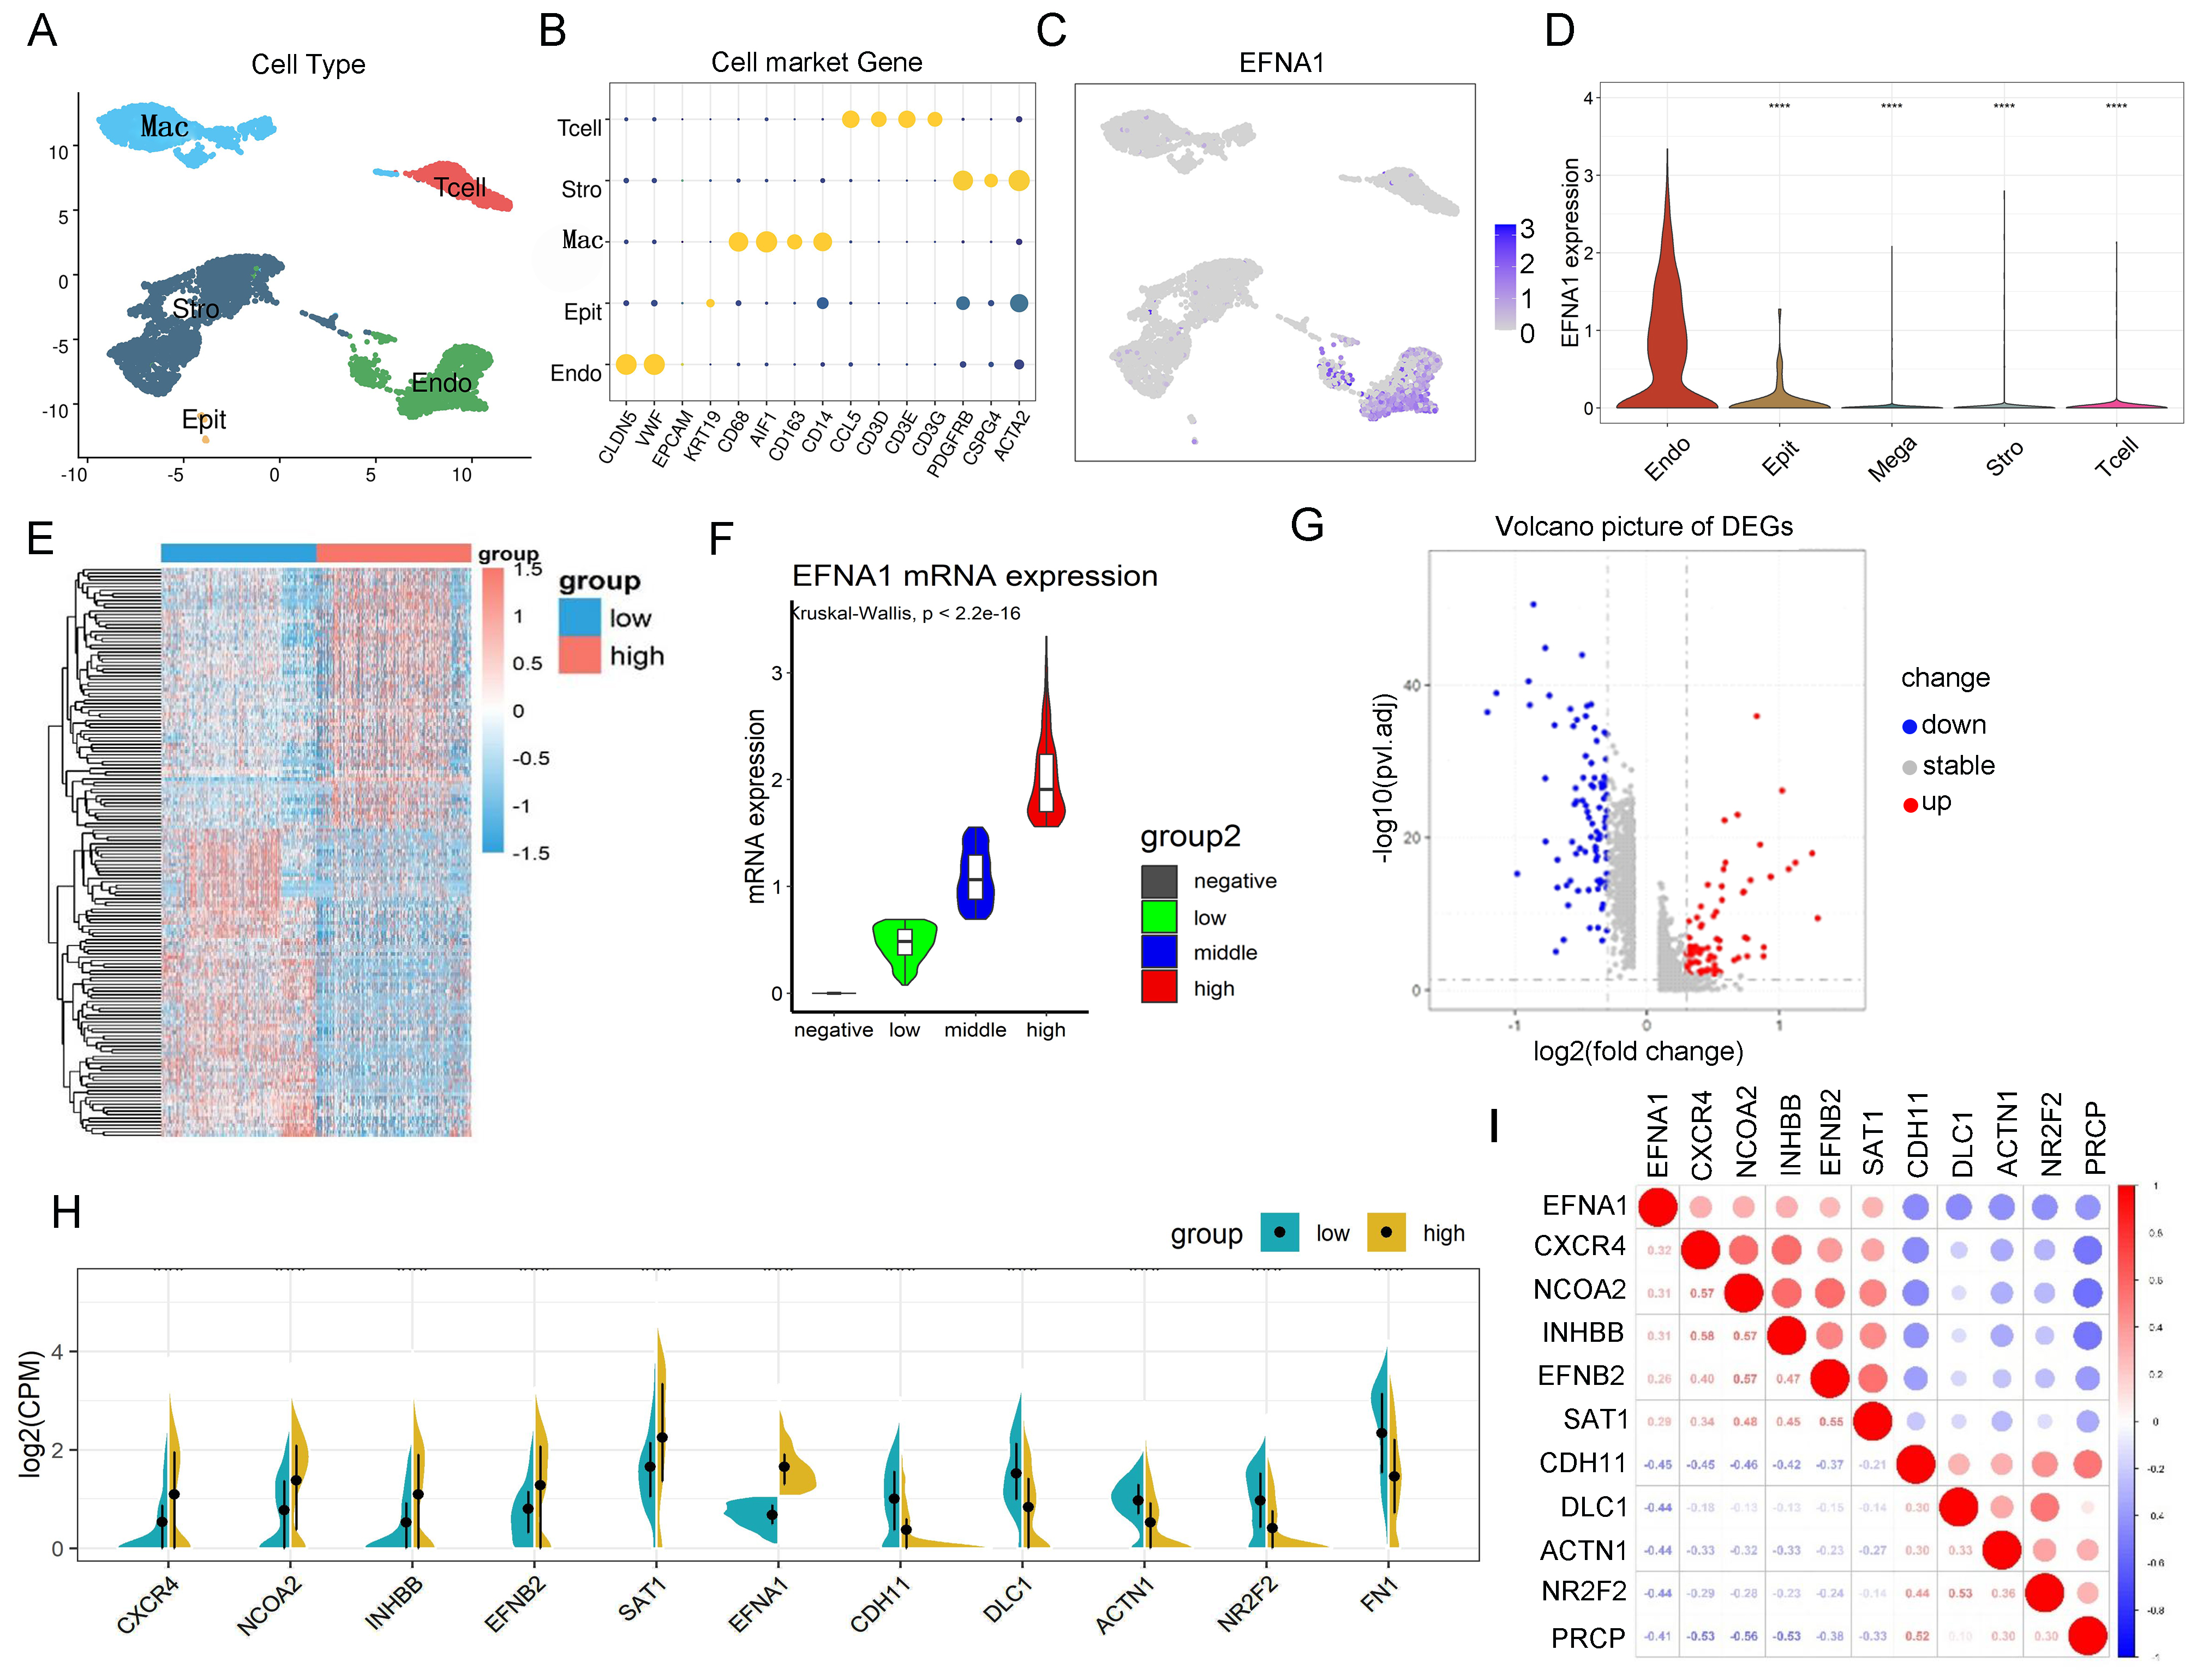
 Figure 2 of
Zhang, Mol Vis 2025; 31:597-616.
Figure 2 of
Zhang, Mol Vis 2025; 31:597-616.