Figure 1. Differential gene expression analysis. A. Volcano plot of upregulated genes in the data sets GSE236333, GSE179568, GSE185011, and GSE221521. B. Venn diagram of gene intersection analysis between GSE236333 and GSE179568, as well as between GSE185011 and GSE221521.
C. The highly expressed genes (72+27) in DR retinal tissue and peripheral blood samples were imported into the STRING database,
and a network of moderately associated genes (interaction score >0.4) was selected. The highly related genes were further
selected using the betweenness centrality method in Cytoscape with the CytoNCA plugin package. D. Downstream target genes were predicted using the CHEA and ENCODE databases, and an intersection analysis was performed with
the 72 upregulated genes in DR retinal tissue. E. Gene Ontology enrichment analysis of the 72 upregulated genes in DR retinal tissue. F–I. Expression differences of STAT5A, EFNA1, STAT1, and IL-15 between two groups.
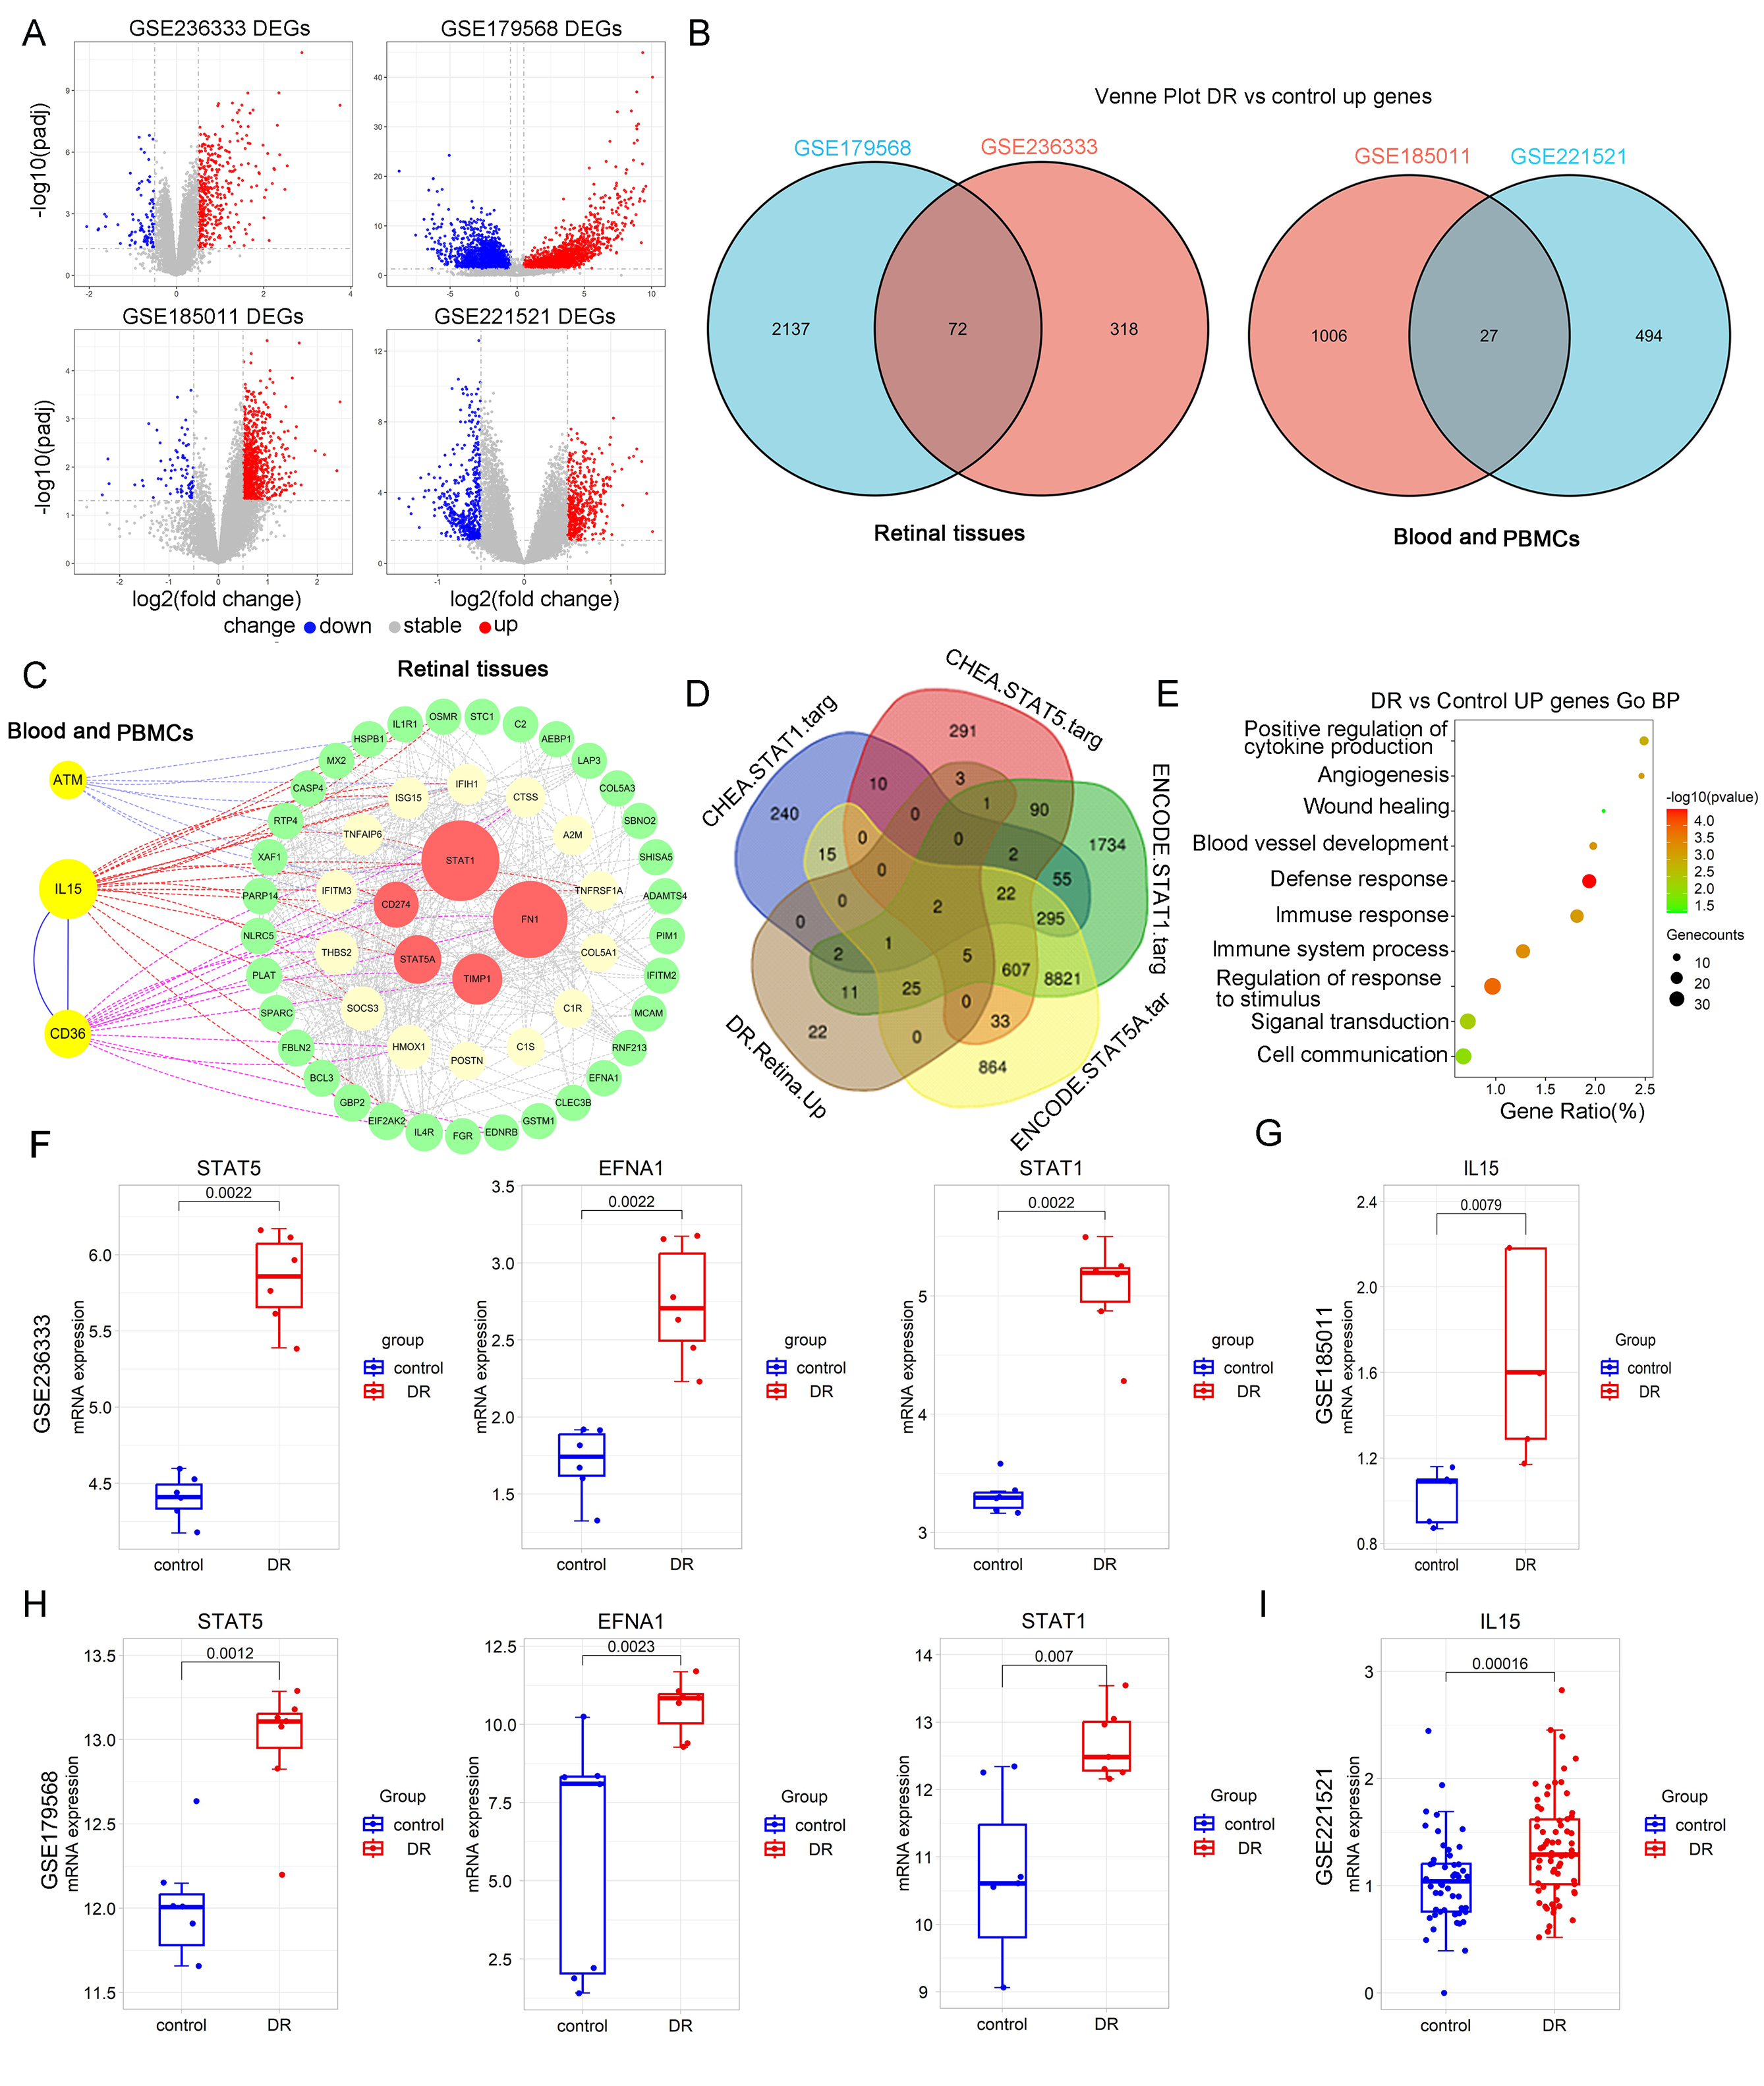
 Figure 1 of
Zhang, Mol Vis 2025; 31:597-616.
Figure 1 of
Zhang, Mol Vis 2025; 31:597-616.