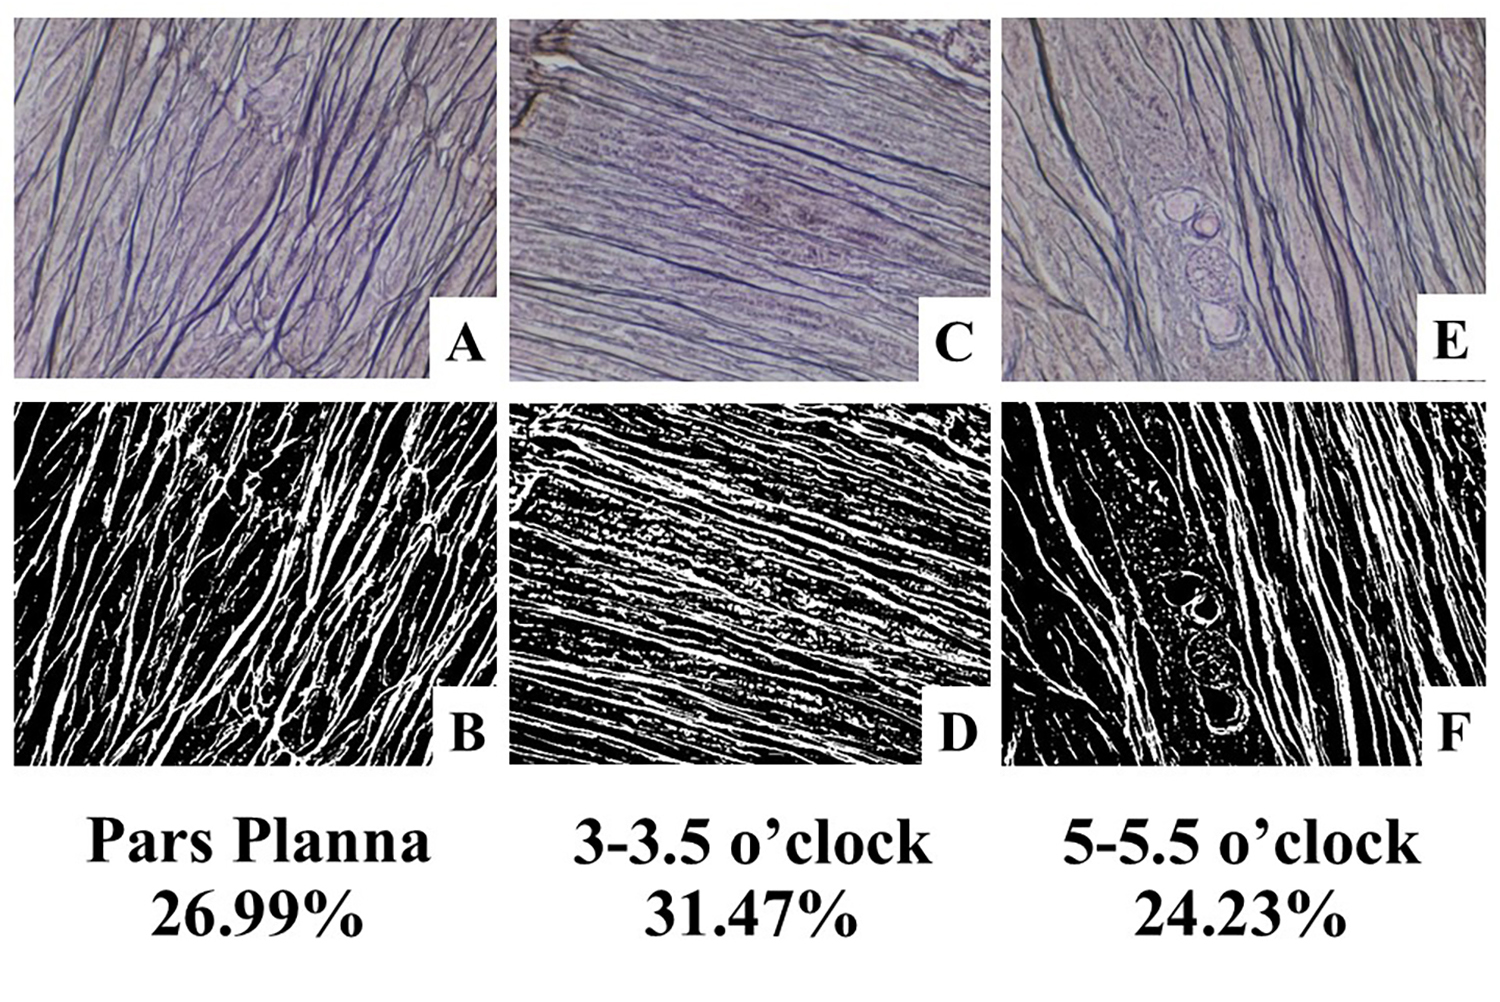
Figure 9. Reticular fiber density in the three regions from
Figure 8, shows the highest density at 3:00–3:30. Original magnification is x200. A and B demonstrate the pars plana with 26.99%.,
C and D, 3:00–3:30 with 31.47% and E and F, 5:00–5:30 with 24.23%.
 Figure 9 of
Kakizaki, Mol Vis 2025; 31:584-595.
Figure 9 of
Kakizaki, Mol Vis 2025; 31:584-595.