Figure 3 of
Kakizaki, Mol Vis 2025; 31:584-595.
Figure 3.
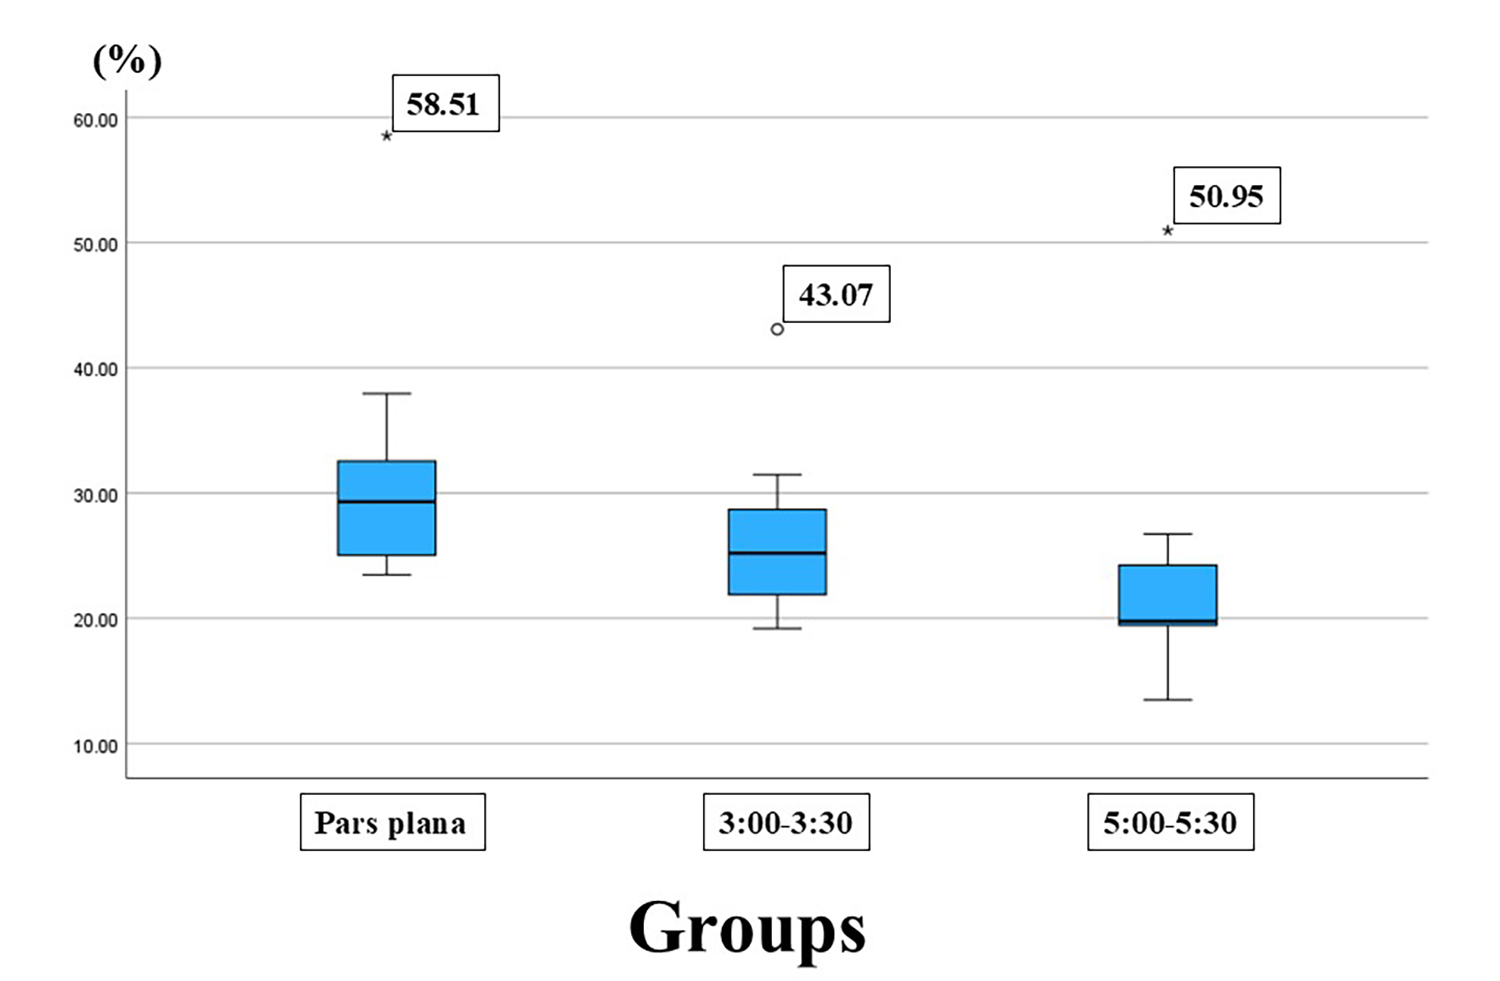
Three scleral regions are illustrated. Box-and-whisker plot of reticular fiber density across three scleral regions. Case 12 was identified as an outlier.
 Figure 3 of
Kakizaki, Mol Vis 2025; 31:584-595.
Figure 3 of
Kakizaki, Mol Vis 2025; 31:584-595.