Figure 6 of
Peng, Mol Vis 2025; 31:570-582.
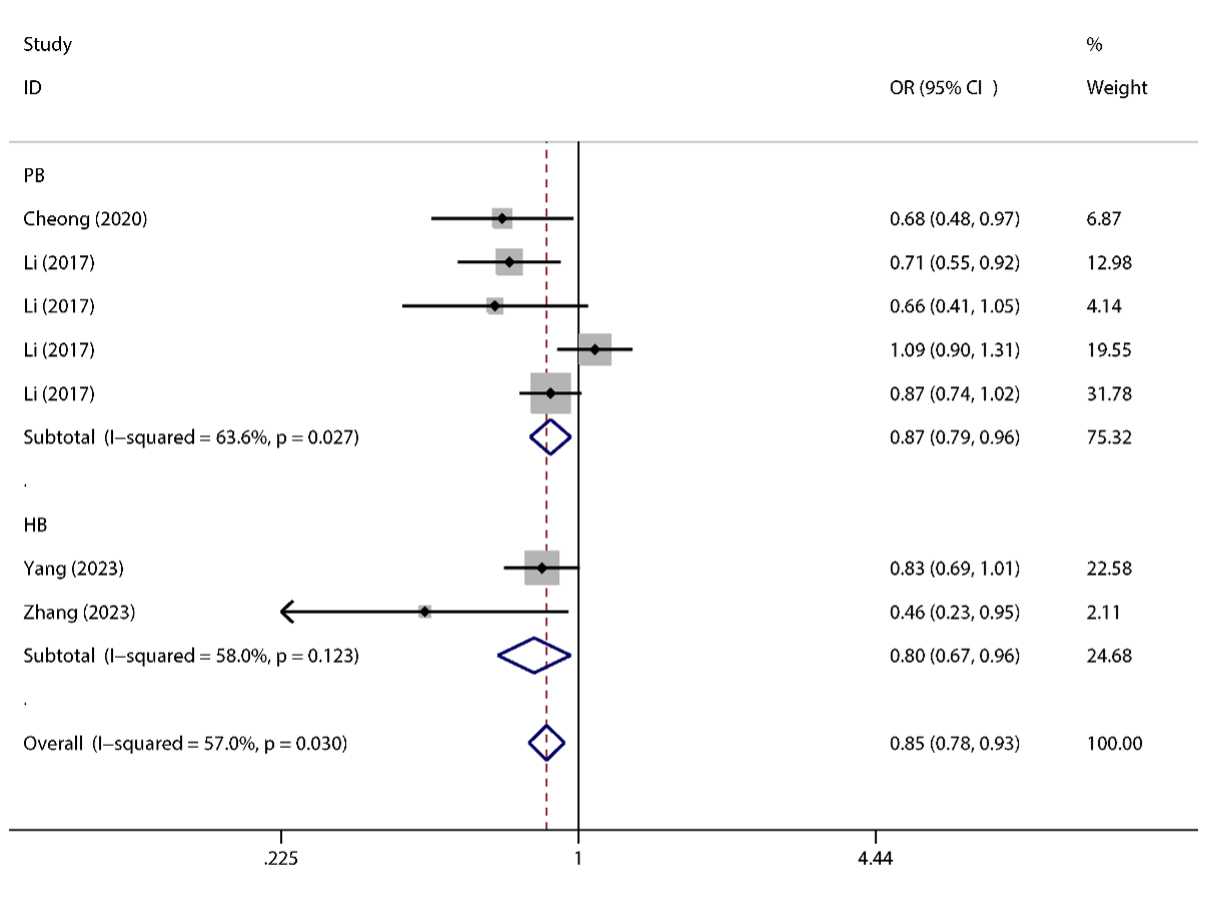
Figure 6.
Forest plots corresponding to high myopia risk between the
SNTB1
rs6469937
polymorphism in the A-allele versus the G-allele in total.
 Figure 6 of
Peng, Mol Vis 2025; 31:570-582. Figure 6 of
Peng, Mol Vis 2025; 31:570-582.
Figure 6 of
Peng, Mol Vis 2025; 31:570-582. Figure 6 of
Peng, Mol Vis 2025; 31:570-582.