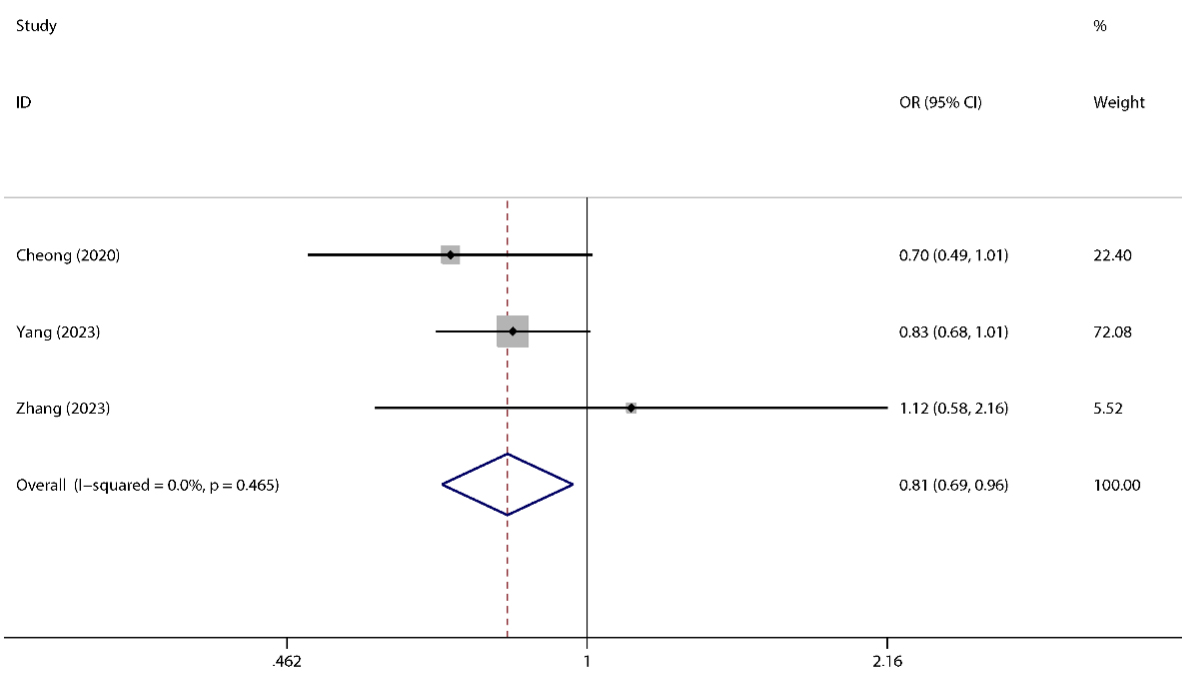
Figure 4. Forest plots corresponding to high myopia risk between the
SNTB1rs4455882 polymorphism in the G-allele versus the A-allele in total. The squares and horizontal lines respectively correspond to the
study-specific ORs and 95% CIs, with the square area being indicative of weight (the inverse of the variance). Diamonds additionally
reflect the summary OR and 95% CI.
 Figure 4 of
Peng, Mol Vis 2025; 31:570-582.
Figure 4 of
Peng, Mol Vis 2025; 31:570-582.