Figure 3. Using the LDBlockShow software, the LD between SNPs in this region was calculated (using the R2 statistic), and the solid spine of the LD method (BlockType 2) was employed to identify haplotype blocks. LD heatmap: Each
square in the figure represents the LD strength (R2 value) between two SNPs, with colors ranging from white (R2 = 0) to red (R2 = 1). Haplotype blocks: The triangular regions in the figure are divided into multiple blocks, where SNPs within each block
exhibit strong LD, representing a potential haplotype. Significant SNPs: The four annotated SNPs are located at specific positions
on chromosome 8. Their linkage with other SNPs can be observed through the LD heatmap.
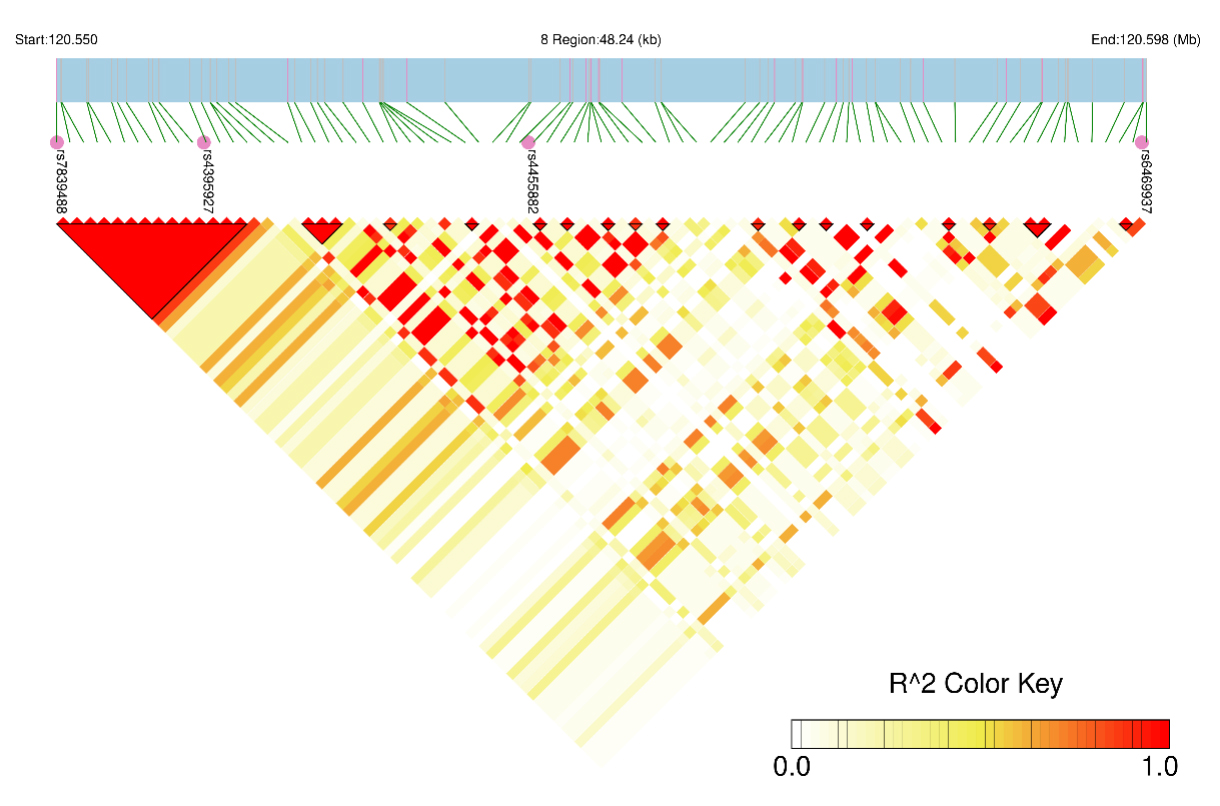
 Figure 3 of
Peng, Mol Vis 2025; 31:570-582.
Figure 3 of
Peng, Mol Vis 2025; 31:570-582.