 Appendix 1 of
Akhtar, Mol Vis 2025; 31:555-567.
Appendix 1 of
Akhtar, Mol Vis 2025; 31:555-567. Appendix 1 of
Akhtar, Mol Vis 2025; 31:555-567.
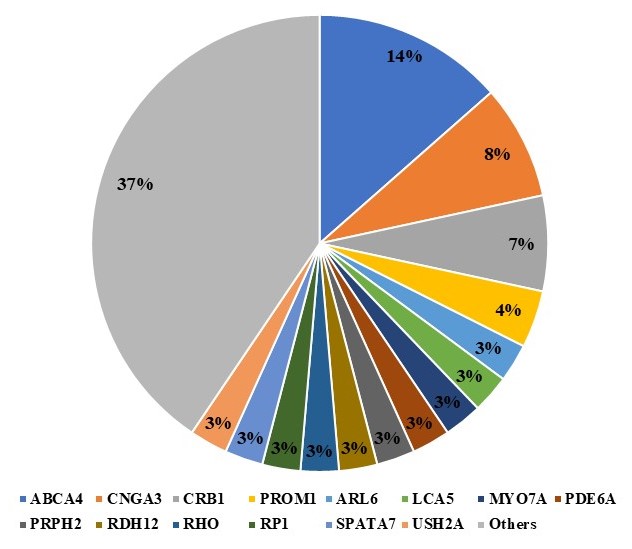
Appendix 1. Frequency distribution of identified variants in 72 IRDs analyzed families.
To access the data, click or select the words “Appendix 1.” The Pie chart show frequency distribution of identified variants in IRDs reported genes in seventy two Pakistani families. Each color is representing frequency of respective gene while the category “others” is used for the group of retinal dystrophy genes identified only in each single family.