Figure 3. Functional enrichment analysis of ferroptosis-related DEGs. A: Gene Ontology (GO) enrichment analysis was performed on the ferroptosis-related differentially expressed genes (DEGs), with
results summarized in bubble plots representing three functional categories: biological process (BP), cellular component (CC),
and molecular function (MF). B: Kyoto Encyclopedia of Genes and Genomes (KEGG) pathway enrichment analysis of the ferroptosis-related DEGs was displayed
in the form of a bubble plot. C: Gene Set Enrichment Analysis (GSEA) was conducted to identify the most significantly enriched gene sets in the GSE135844
dataset.
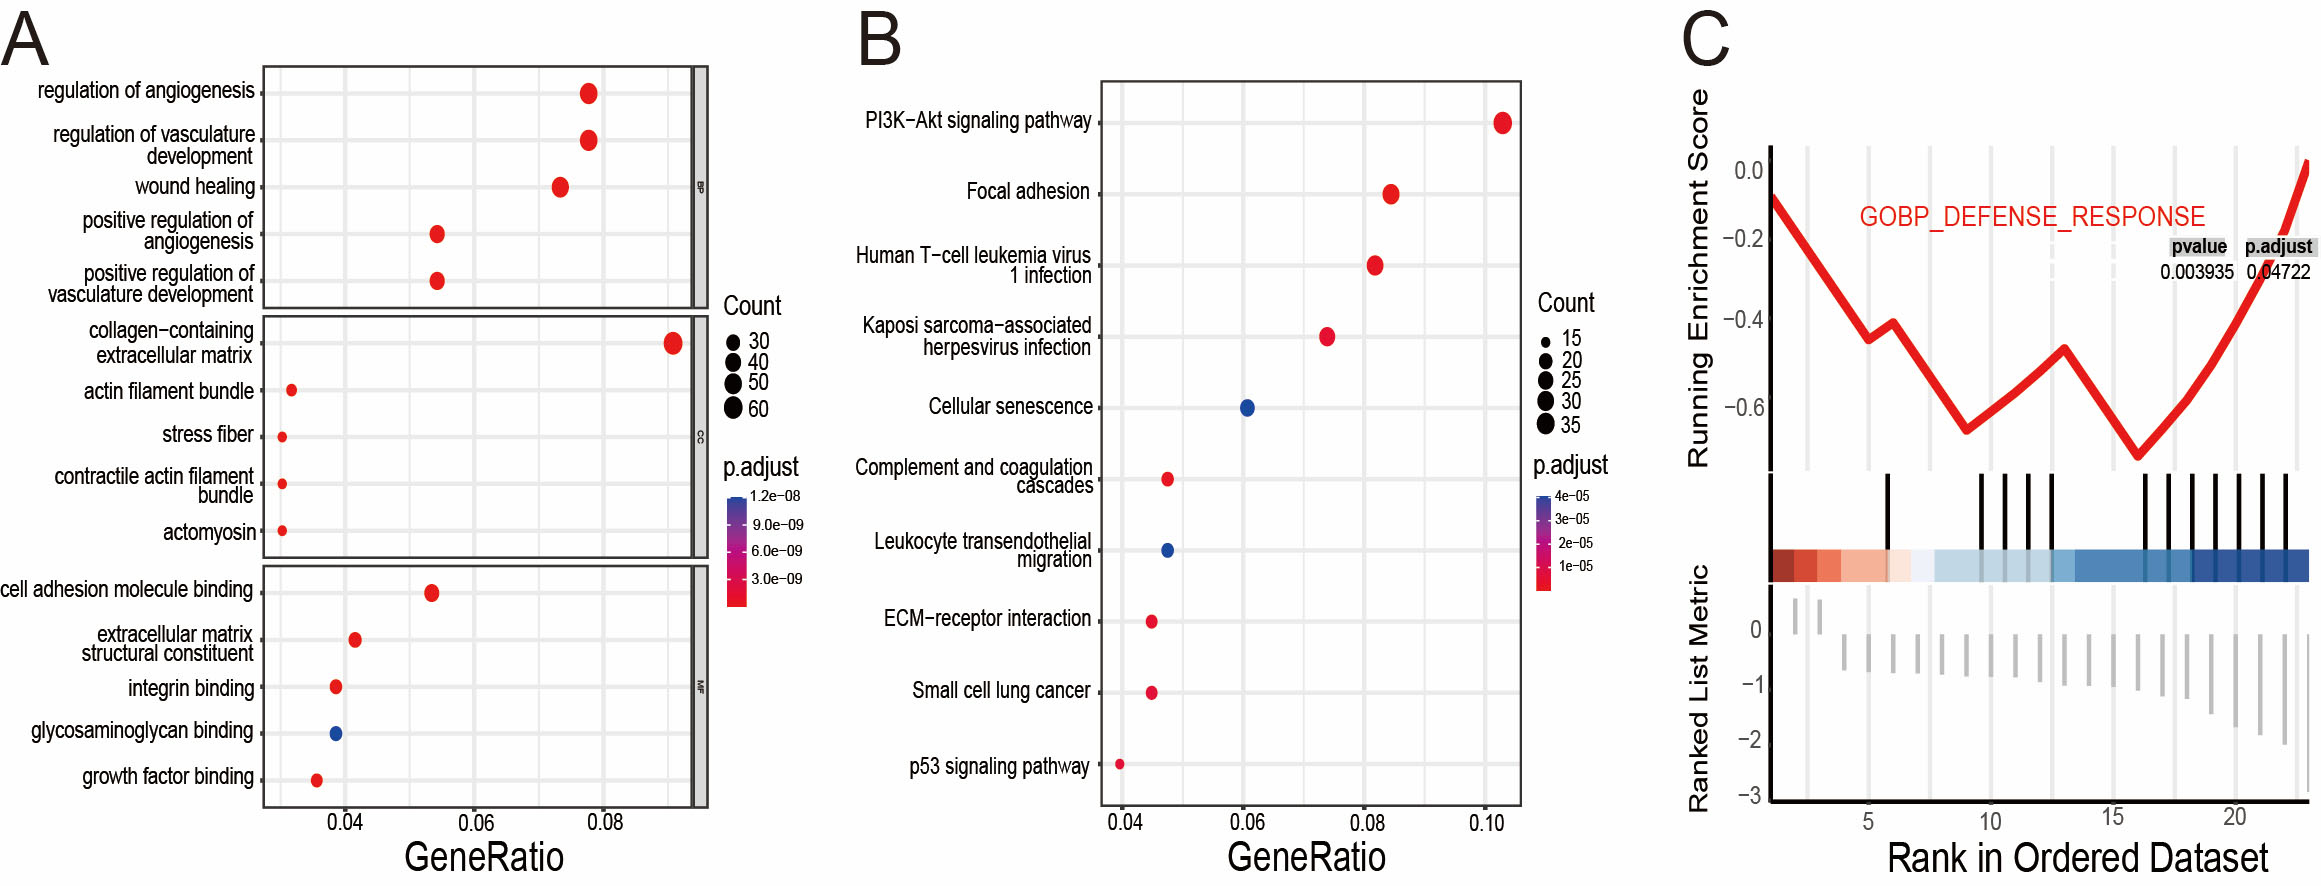
 Figure 3 of
Liao, Mol Vis 2025; 31:515-524.
Figure 3 of
Liao, Mol Vis 2025; 31:515-524.