Figure 2. Ferroptosis-related genes and Venn analysis. A: A Venn diagram was constructed to show the intersection between differentially expressed genes (DEGs) from dataset GSE135844
and known ferroptosis-related genes. The left count (720 genes) represented DEGs that are specific to the GSE135844 dataset.
The middle count (23 genes) indicated the number of DEGs that are associated with ferroptosis. The right count (233 genes)
represented genes that are uniquely associated with ferroptosis from the reference gene set. B: A heatmap displayed the expression patterns of the 23 ferroptosis-related DEGs identified in the Venn analysis. C: A correlation analysis illustrated the relationships among the 23 ferroptosis-related DEGs.
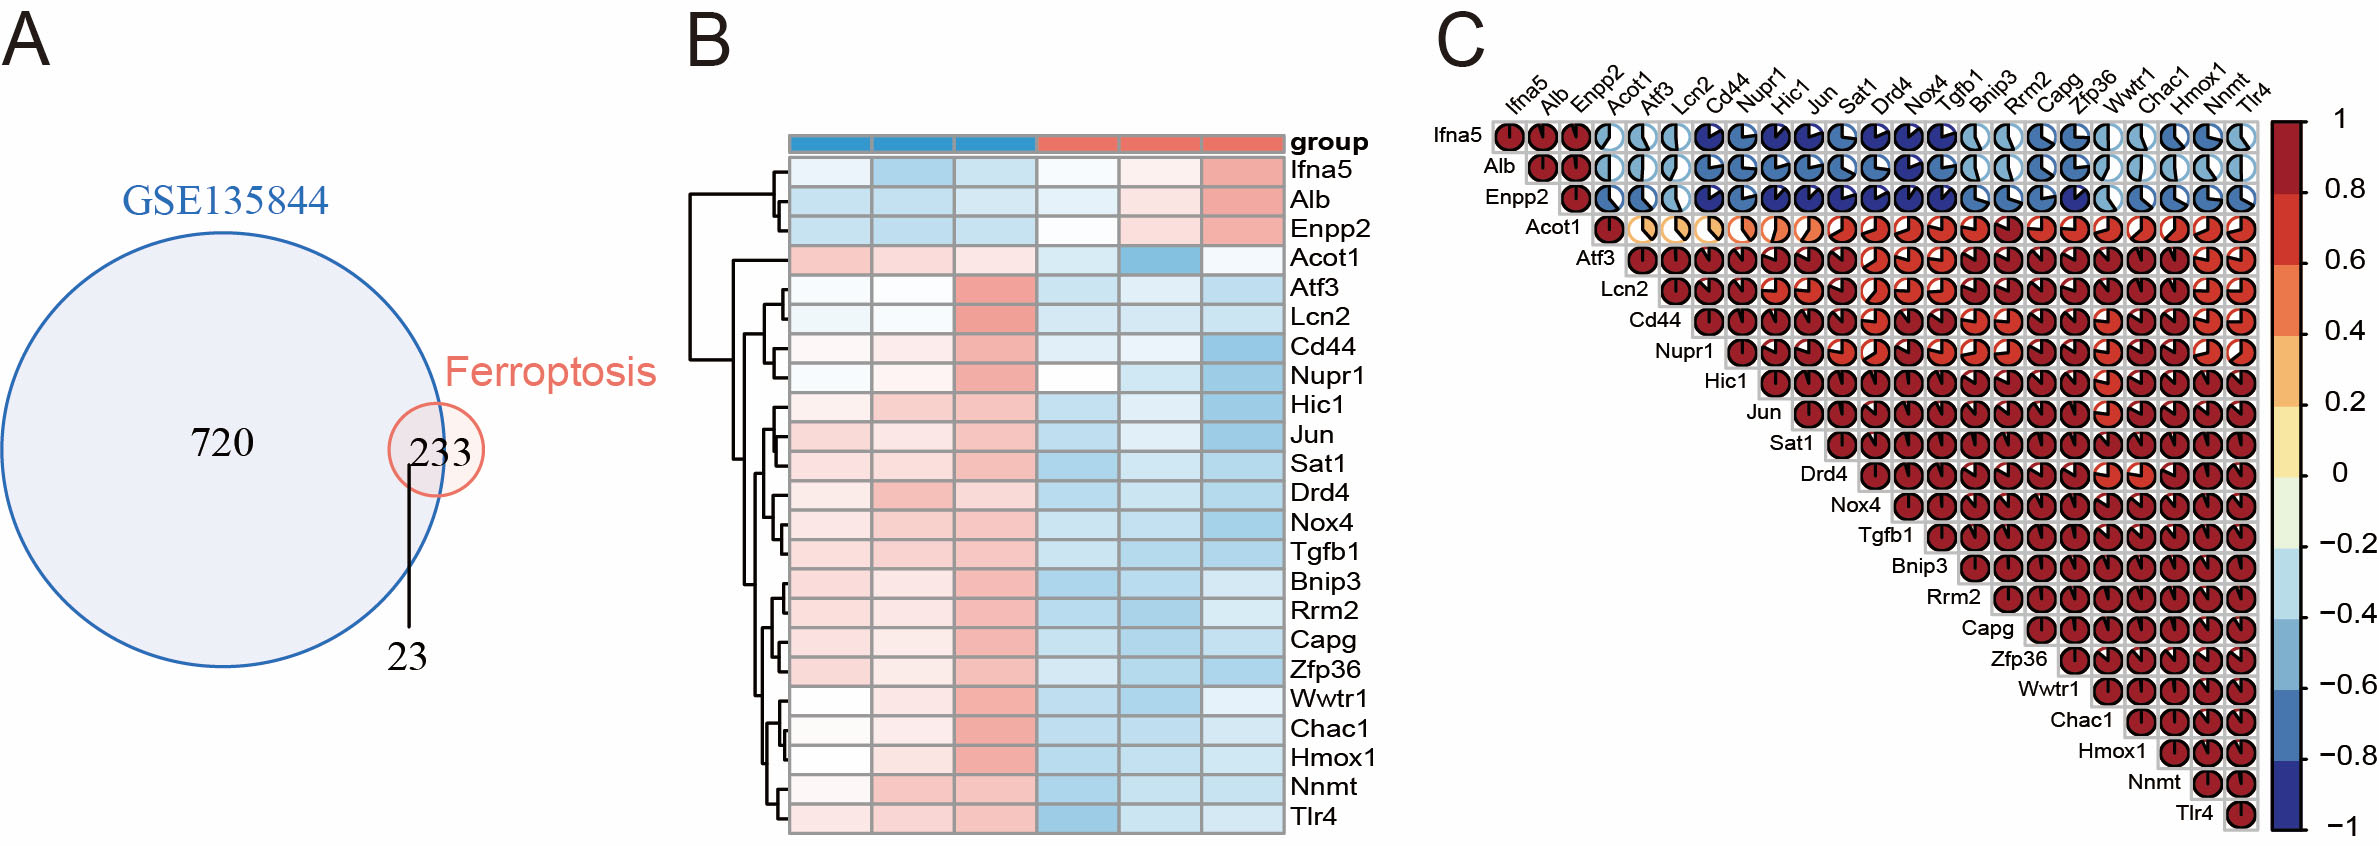
 Figure 2 of
Liao, Mol Vis 2025; 31:515-524.
Figure 2 of
Liao, Mol Vis 2025; 31:515-524.