Figure 1. Identification of differentially expressed genes (DEGs). A: Differential expression gene analysis was performed on the retinopathy of prematurity (ROP) dataset GSE135844. Blue nodes
represented genes downregulated in ROP, red nodes represented upregulated genes, and gray nodes indicated genes with no significant
difference compared with controls. B: The heatmap illustrated the expression patterns of the identified DEGs. The oxygen-induced retinopathy (OIR) model was commonly
used to simulate the pathological process of ROP in experimental animals.
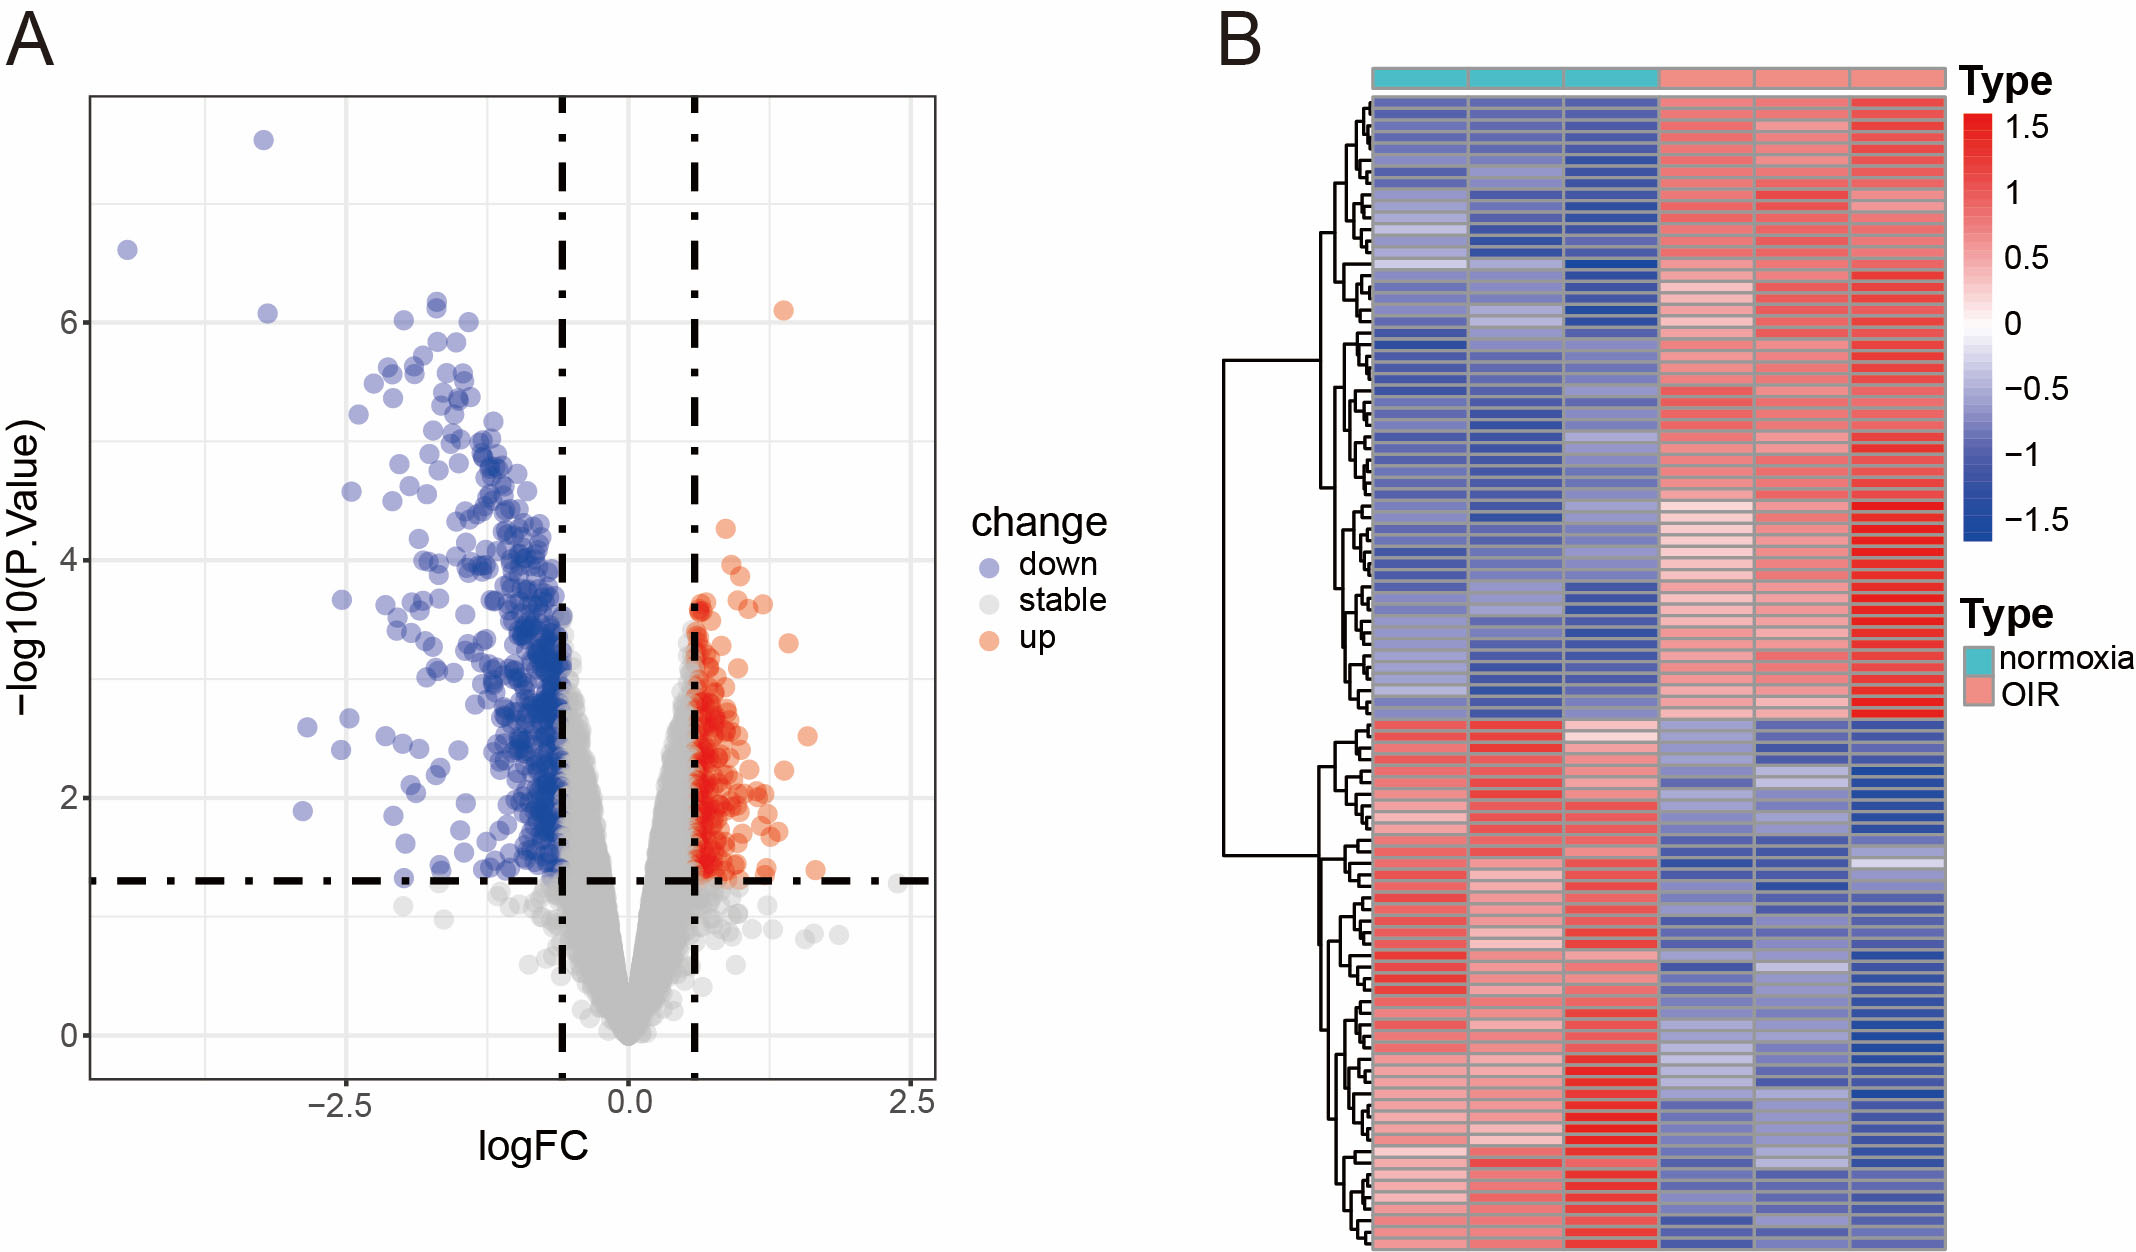
 Figure 1 of
Liao, Mol Vis 2025; 31:515-524.
Figure 1 of
Liao, Mol Vis 2025; 31:515-524.