Figure 5. Fundus autofluorescence (FAF) and optical coherence tomography (OCT) of both eyes for P17 and P26, along with color fundus
photography for P17. A. In P26, FAF images reveal a hyperautofluorescent ring surrounding the macular region, along with hypoautofluorescence at
the level of the vascular arcades. The peripheral retina appears relatively preserved. OCT images confirm the presence of
bilateral cystoid macular edema (indicated by white arrows) consistent with intraretinal fluid accumulation and retinal layer
separation. B. In P17, FAF images show patchy areas of hypoautofluorescent areas, which correspond to retinal atrophy (denoted by white
asterisks), as well as crystalline deposits scattered throughout the posterior pole. Color fundus photography corroborates
these findings, showing relatively preserved macular pigmentation with visible crystalline material.
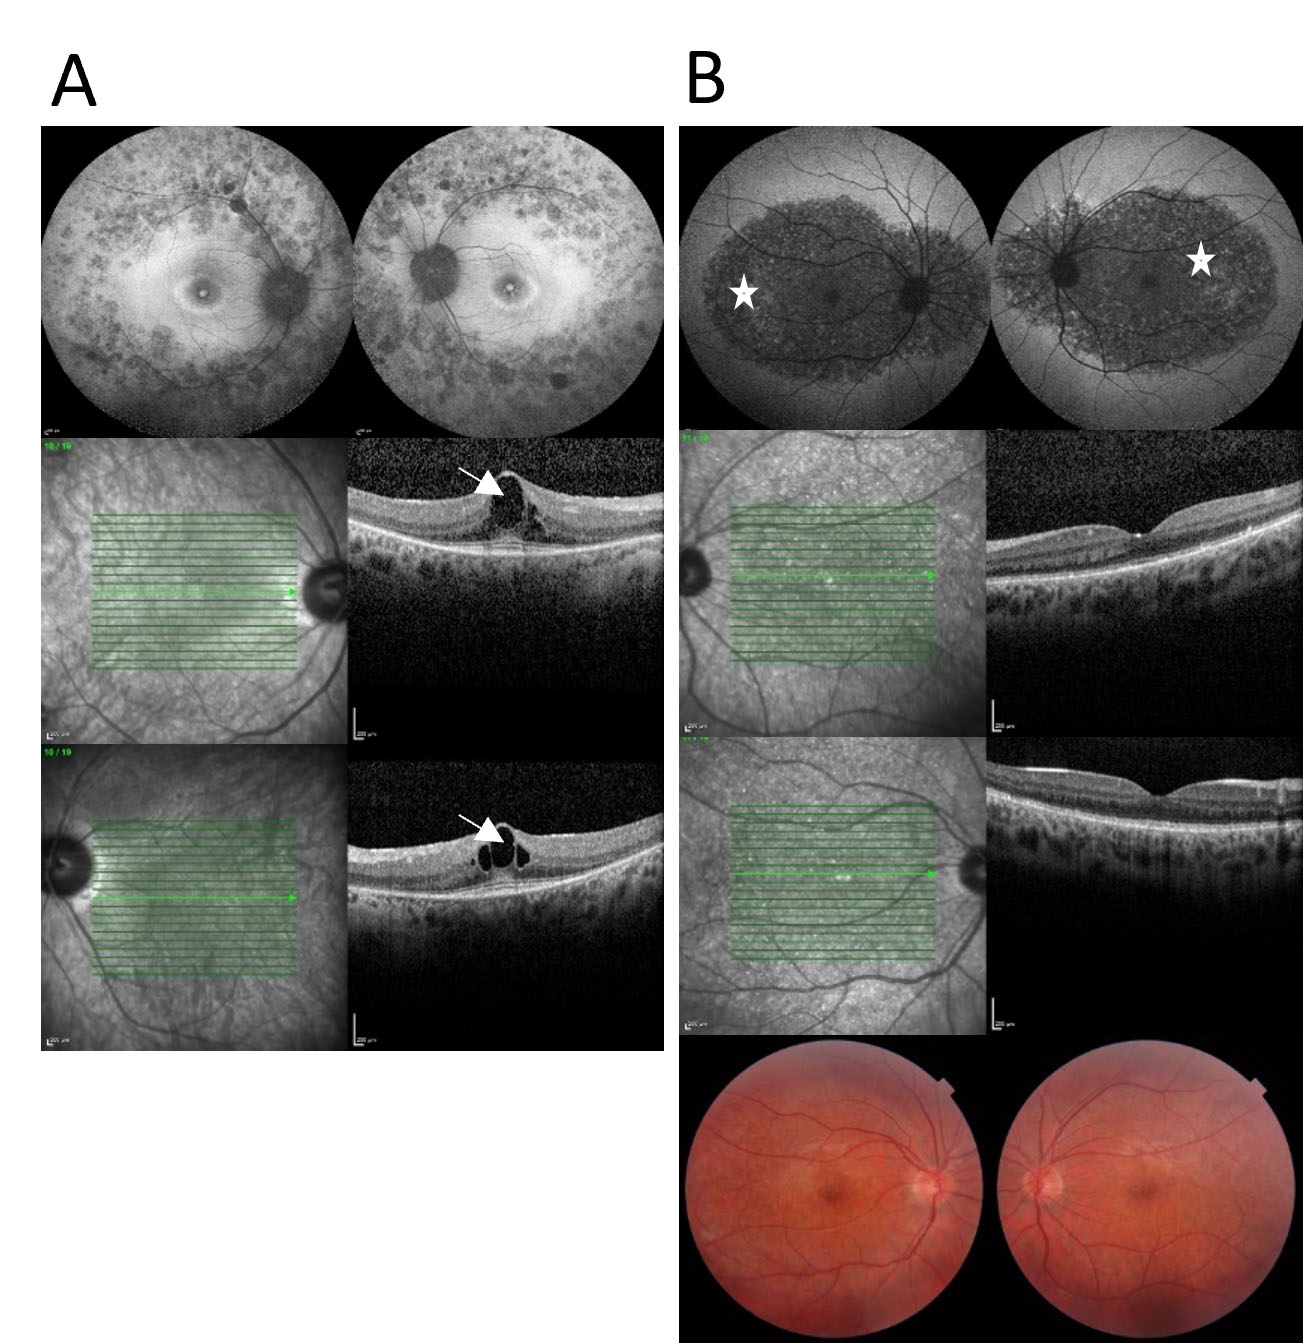
 Figure 5 of
Keles, Mol Vis 2025; 31:502-513.
Figure 5 of
Keles, Mol Vis 2025; 31:502-513.