Figure 3. Fundus autofluorescence (FAF) and optical coherence tomography (OCT) of both eyes for P1 and P11. A. FAF images from P1 show a hyperautofluorescent parafoveal ring and scattered peripheral flecks of increased autofluorescence
(blue arrowheads), along with central hypoautofluorescent lesions compatible with macular atrophy (red arrow). Corresponding
OCT scans demonstrate preserved foveal architecture with subtle disruption in the outer retinal layers. B. FAF images from
P11 with retinitis pigmentosa display widespread retinal atrophy. OCT scans reveal significant degeneration of the outer retina,
including loss of the ellipsoid zone, which reveals macular atrophy (red arrows), and marked peripheral chorioretinal degeneration.
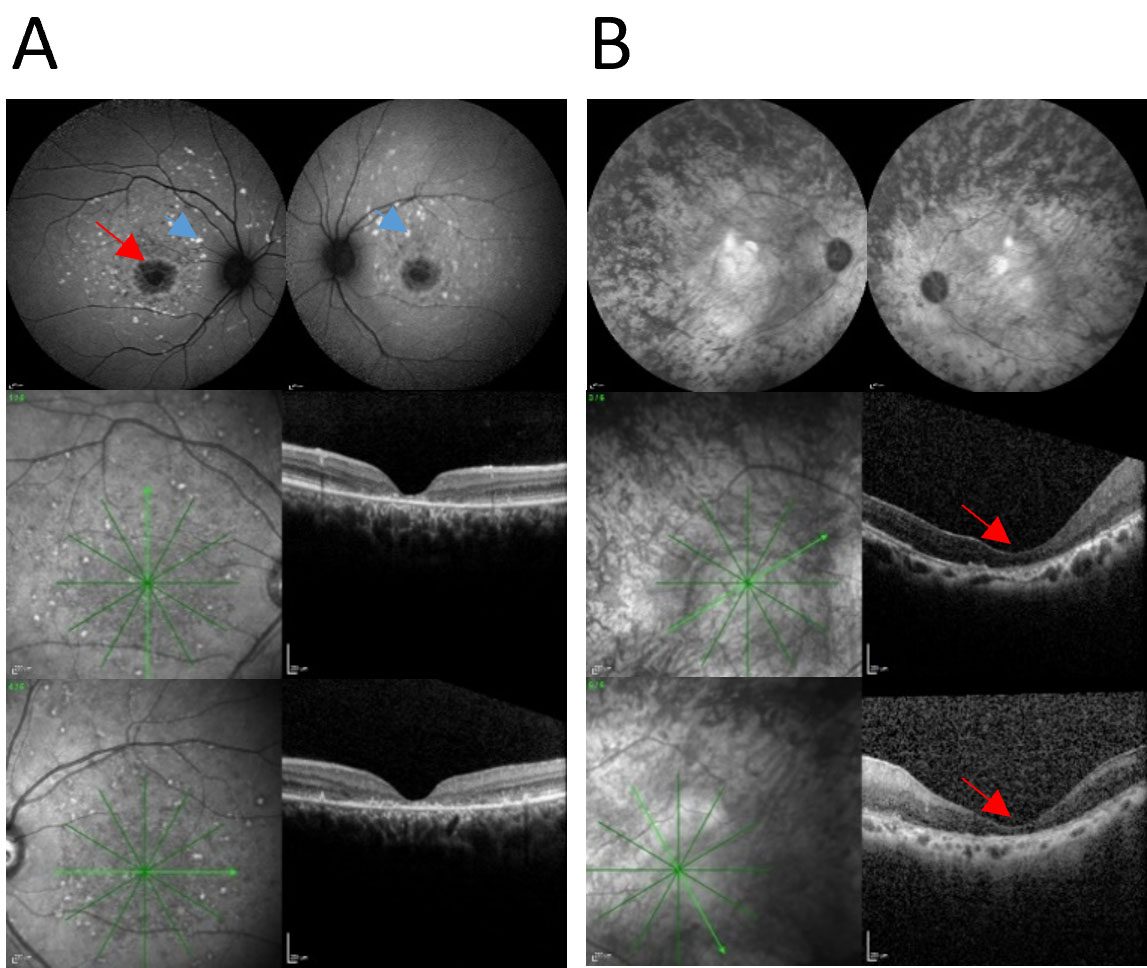
 Figure 3 of
Keles, Mol Vis 2025; 31:502-513.
Figure 3 of
Keles, Mol Vis 2025; 31:502-513.