Figure 2. Summary of smMIP optimization runs. Three optimization runs were performed on genomic DNA from five non-FECD control samples.
A. Number of probes with mean read depth following each optimization run. B. Number of probes that were excluded and redesigned after each run. N/A, not applicable. C. Graphical representation of the number of probes (on the y-axis) and average read depth (on the x-axis) following each run.
D. MiSeq data for the third optimization run for each of the five control samples, highlighting total reads sequenced, number
of usable reads, and percentage of PCR duplicates. Note following each optimization run, the number of probes with an average
read depth greater than 10 increased gradually from 94.8%, then 96.4% to 99.5%.
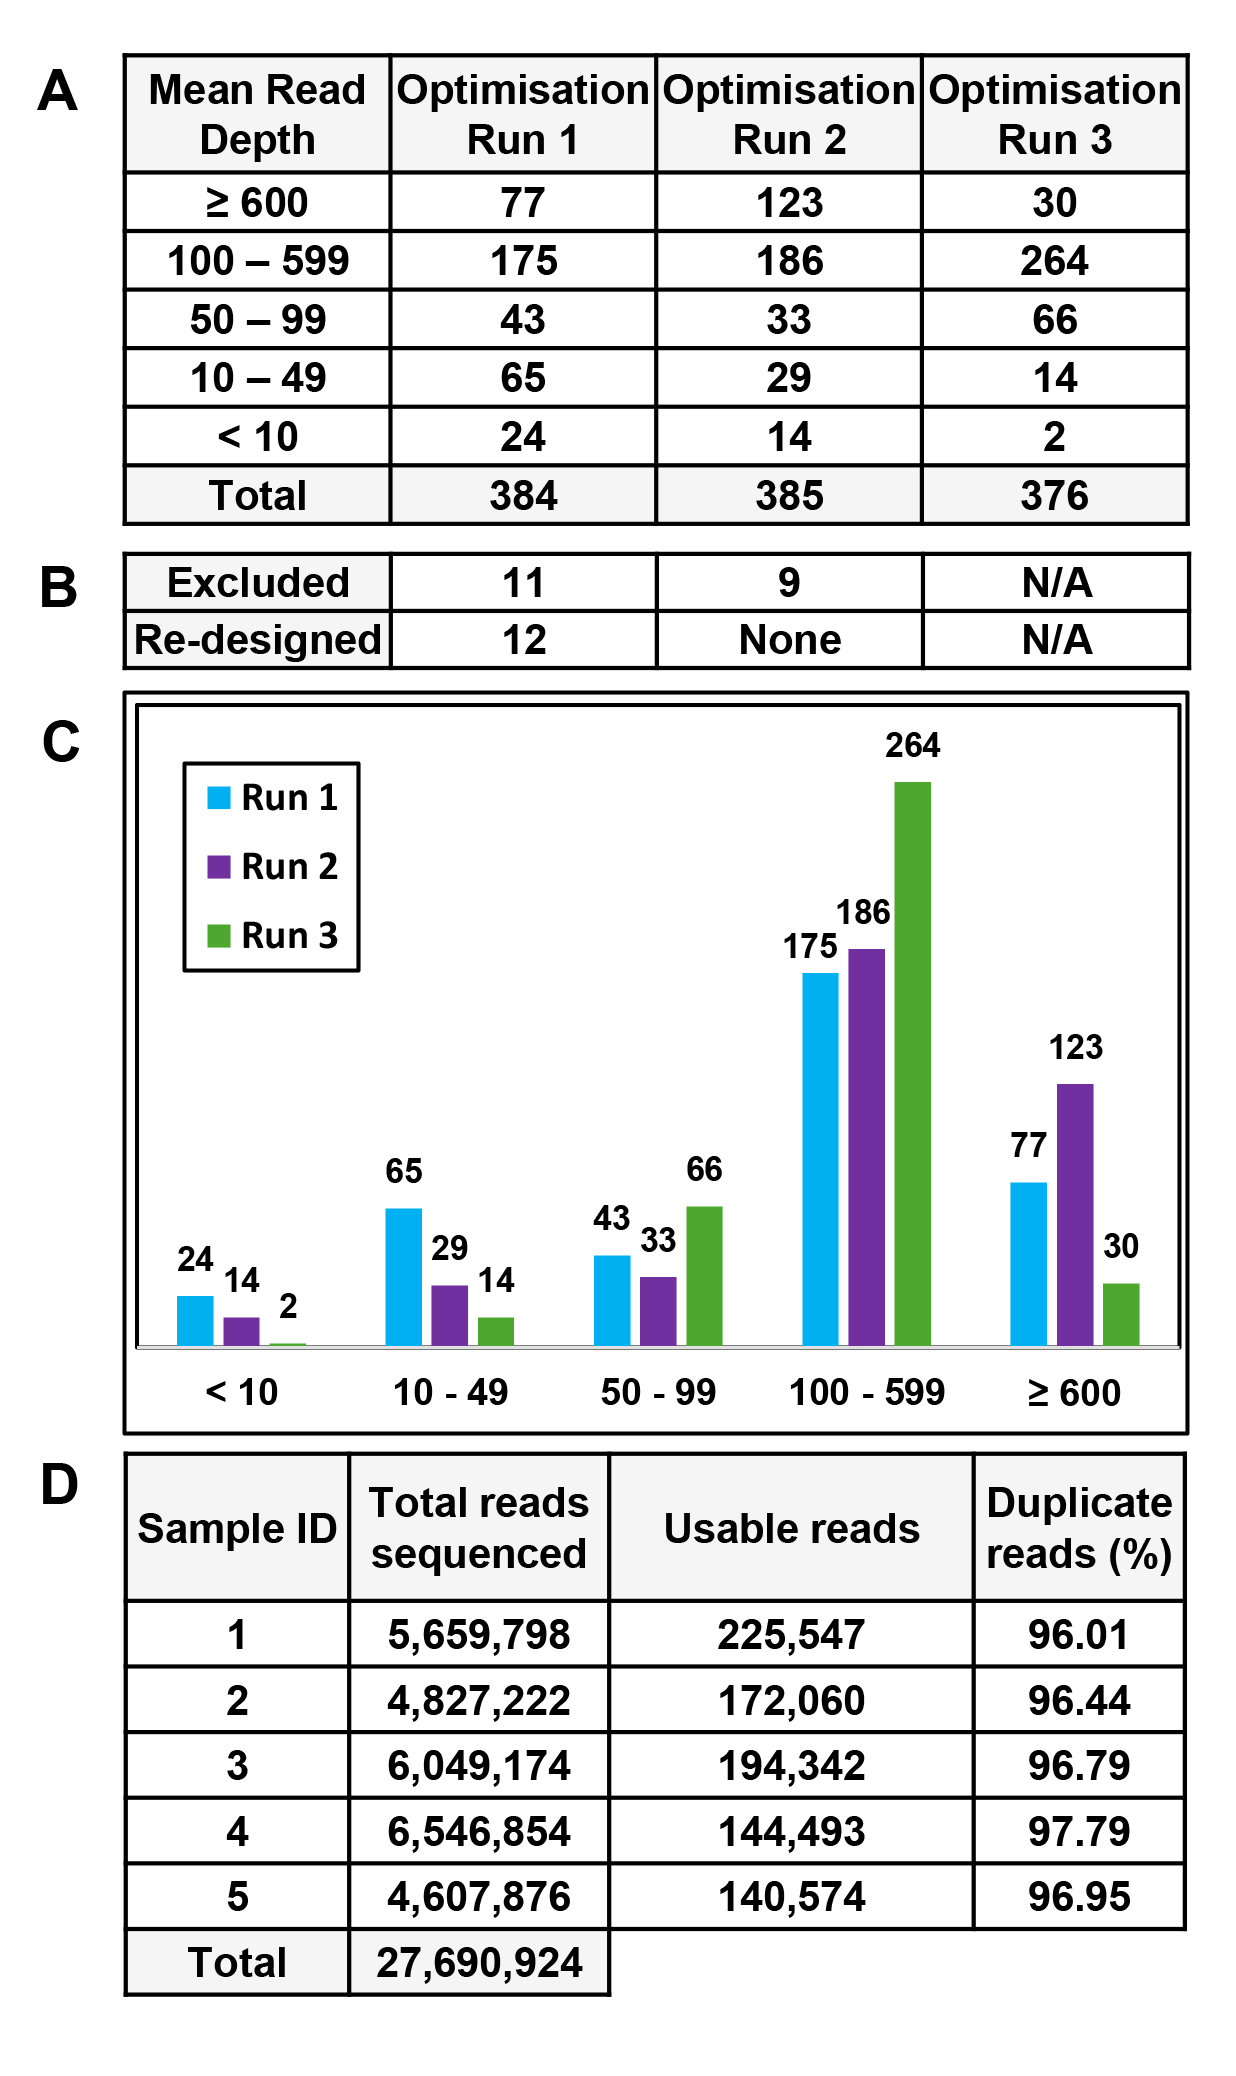
 Figure 2 of
Alayed, Mol Vis 2025; 31:486-500.
Figure 2 of
Alayed, Mol Vis 2025; 31:486-500.