Figure 5. Grm6 is associated with hyperglycemia-induced scotopic vision impairment via the phototransduction pathway. A: The bar plots show the enriched Kyoto Encyclopedia of Genes and Genomes terms for the top 2,000 Grm6-associated genes in
the BXD retinas. The x-axis indicates the number of genes, and the color represents the –log10 (p values). B: Five proteins (Gnat1, Gucy2e, Cnga1, Grk1, and Rgs9) involved in the phototransduction pathway, which were downregulated
in the diabetic retina, are shown in a heatmap. Red indicates the upregulated proteins, while blue represents the downregulated
proteins. C, control group; D, diabetes group. C. These scatterplots illustrate the correlations between grm6 and rgs9. The R and p values are shown. The gene expression data were log2-transformed in this analysis. D: The network included the genes enriched in the phototransduction pathway (orange nodes), glutamate metabolism (purple nodes),
glutamate receptor (green node), and blood glucose level (red node). The red and blue edges show significant positive and
negative correlations, respectively (p<0.05). The thickness of the edges represents the Pearson correlation coefficient. E: Proposed model illustrates that Grm6 was involved in hyperglycemia-induced scotopic vision impairment. The hyperglycemia
led to glutamate accumulation, which decreased Grm6 expression. Grm6 may affect the phototransduction pathway via Rgs9, leading to scotopic vision impairment.
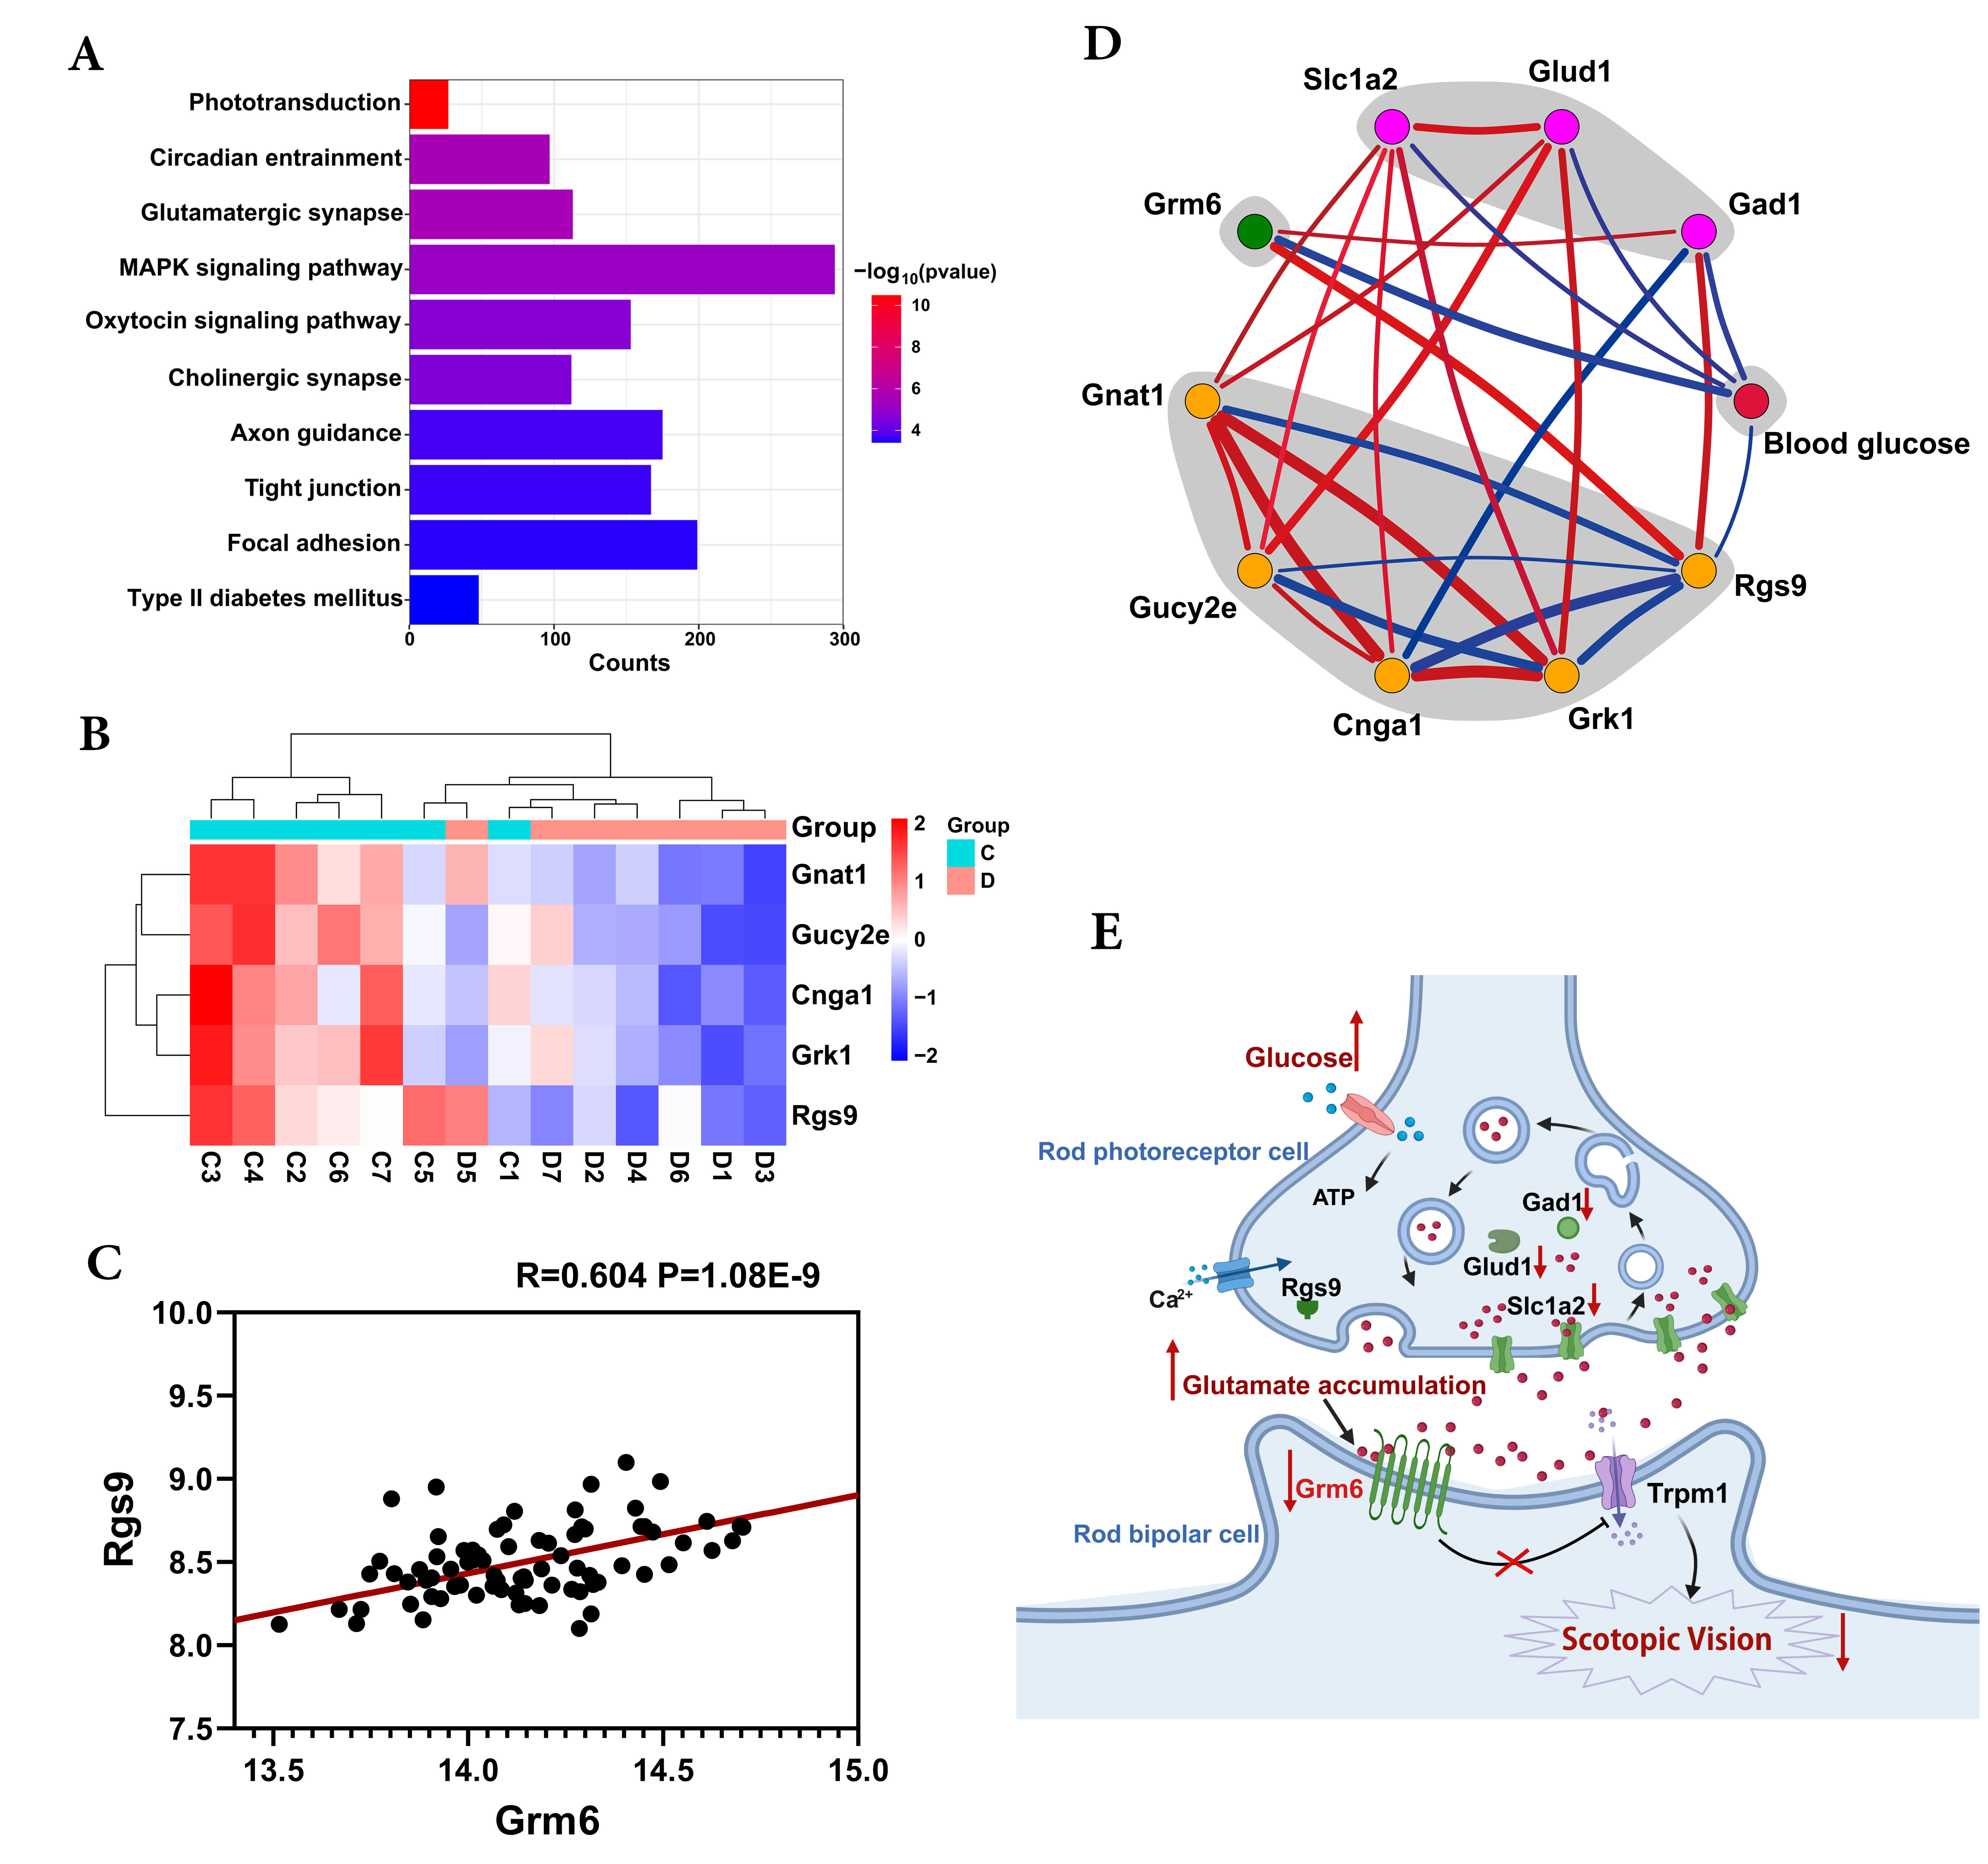
 Figure 5 of
Lian, Mol Vis 2025; 31:440-452.
Figure 5 of
Lian, Mol Vis 2025; 31:440-452.