Figure 4. Grm6 expression is associated with the level of blood glucose. A: The volcano plot shows the correlations between blood glucose level and eight types of metabotropic glutamate receptors.
The x-axis represents the Pearson correlation coefficient, and the y-axis represents the –log10 (p value). The receptor Grm6, marked with a red triangle, was most significantly correlated with blood glucose levels. B: The scatterplots show that the expression levels of Grm6 had a significantly negative correlation with the basal glucose
level (R=–0.5291, p=0.0003). Each dark dot represents a mouse strain. C: The Grm6 expression varied in BXD strains and their parental strains (C57BL/6J and DBA/2J). The x-axis represents the name
of BXD strains and their parents (C57BL/6J and DBA/2J), as well as two F1 strains (D2B6F1 and B6D2F1). The y-axis shows that
the average expression level of Grm6 is 14.16±0.04 (log2 scale, mean ± standard error of the mean). Each bar is marked with a standard error of the mean. D: Quantitative reverse transcription polymerase chain reaction analysis shows that Grm6 expression was decreased significantly
compared with the control group. E: western blot analysis shows that Grm6 expression was decreased in the protein level in diabetic mice retina. F: The quantitative analyses in E were performed by ImageJ 1.46 and GraphPad Prism 8. Data are shown as mean ± standard deviation.
n=3. *p<0.05.
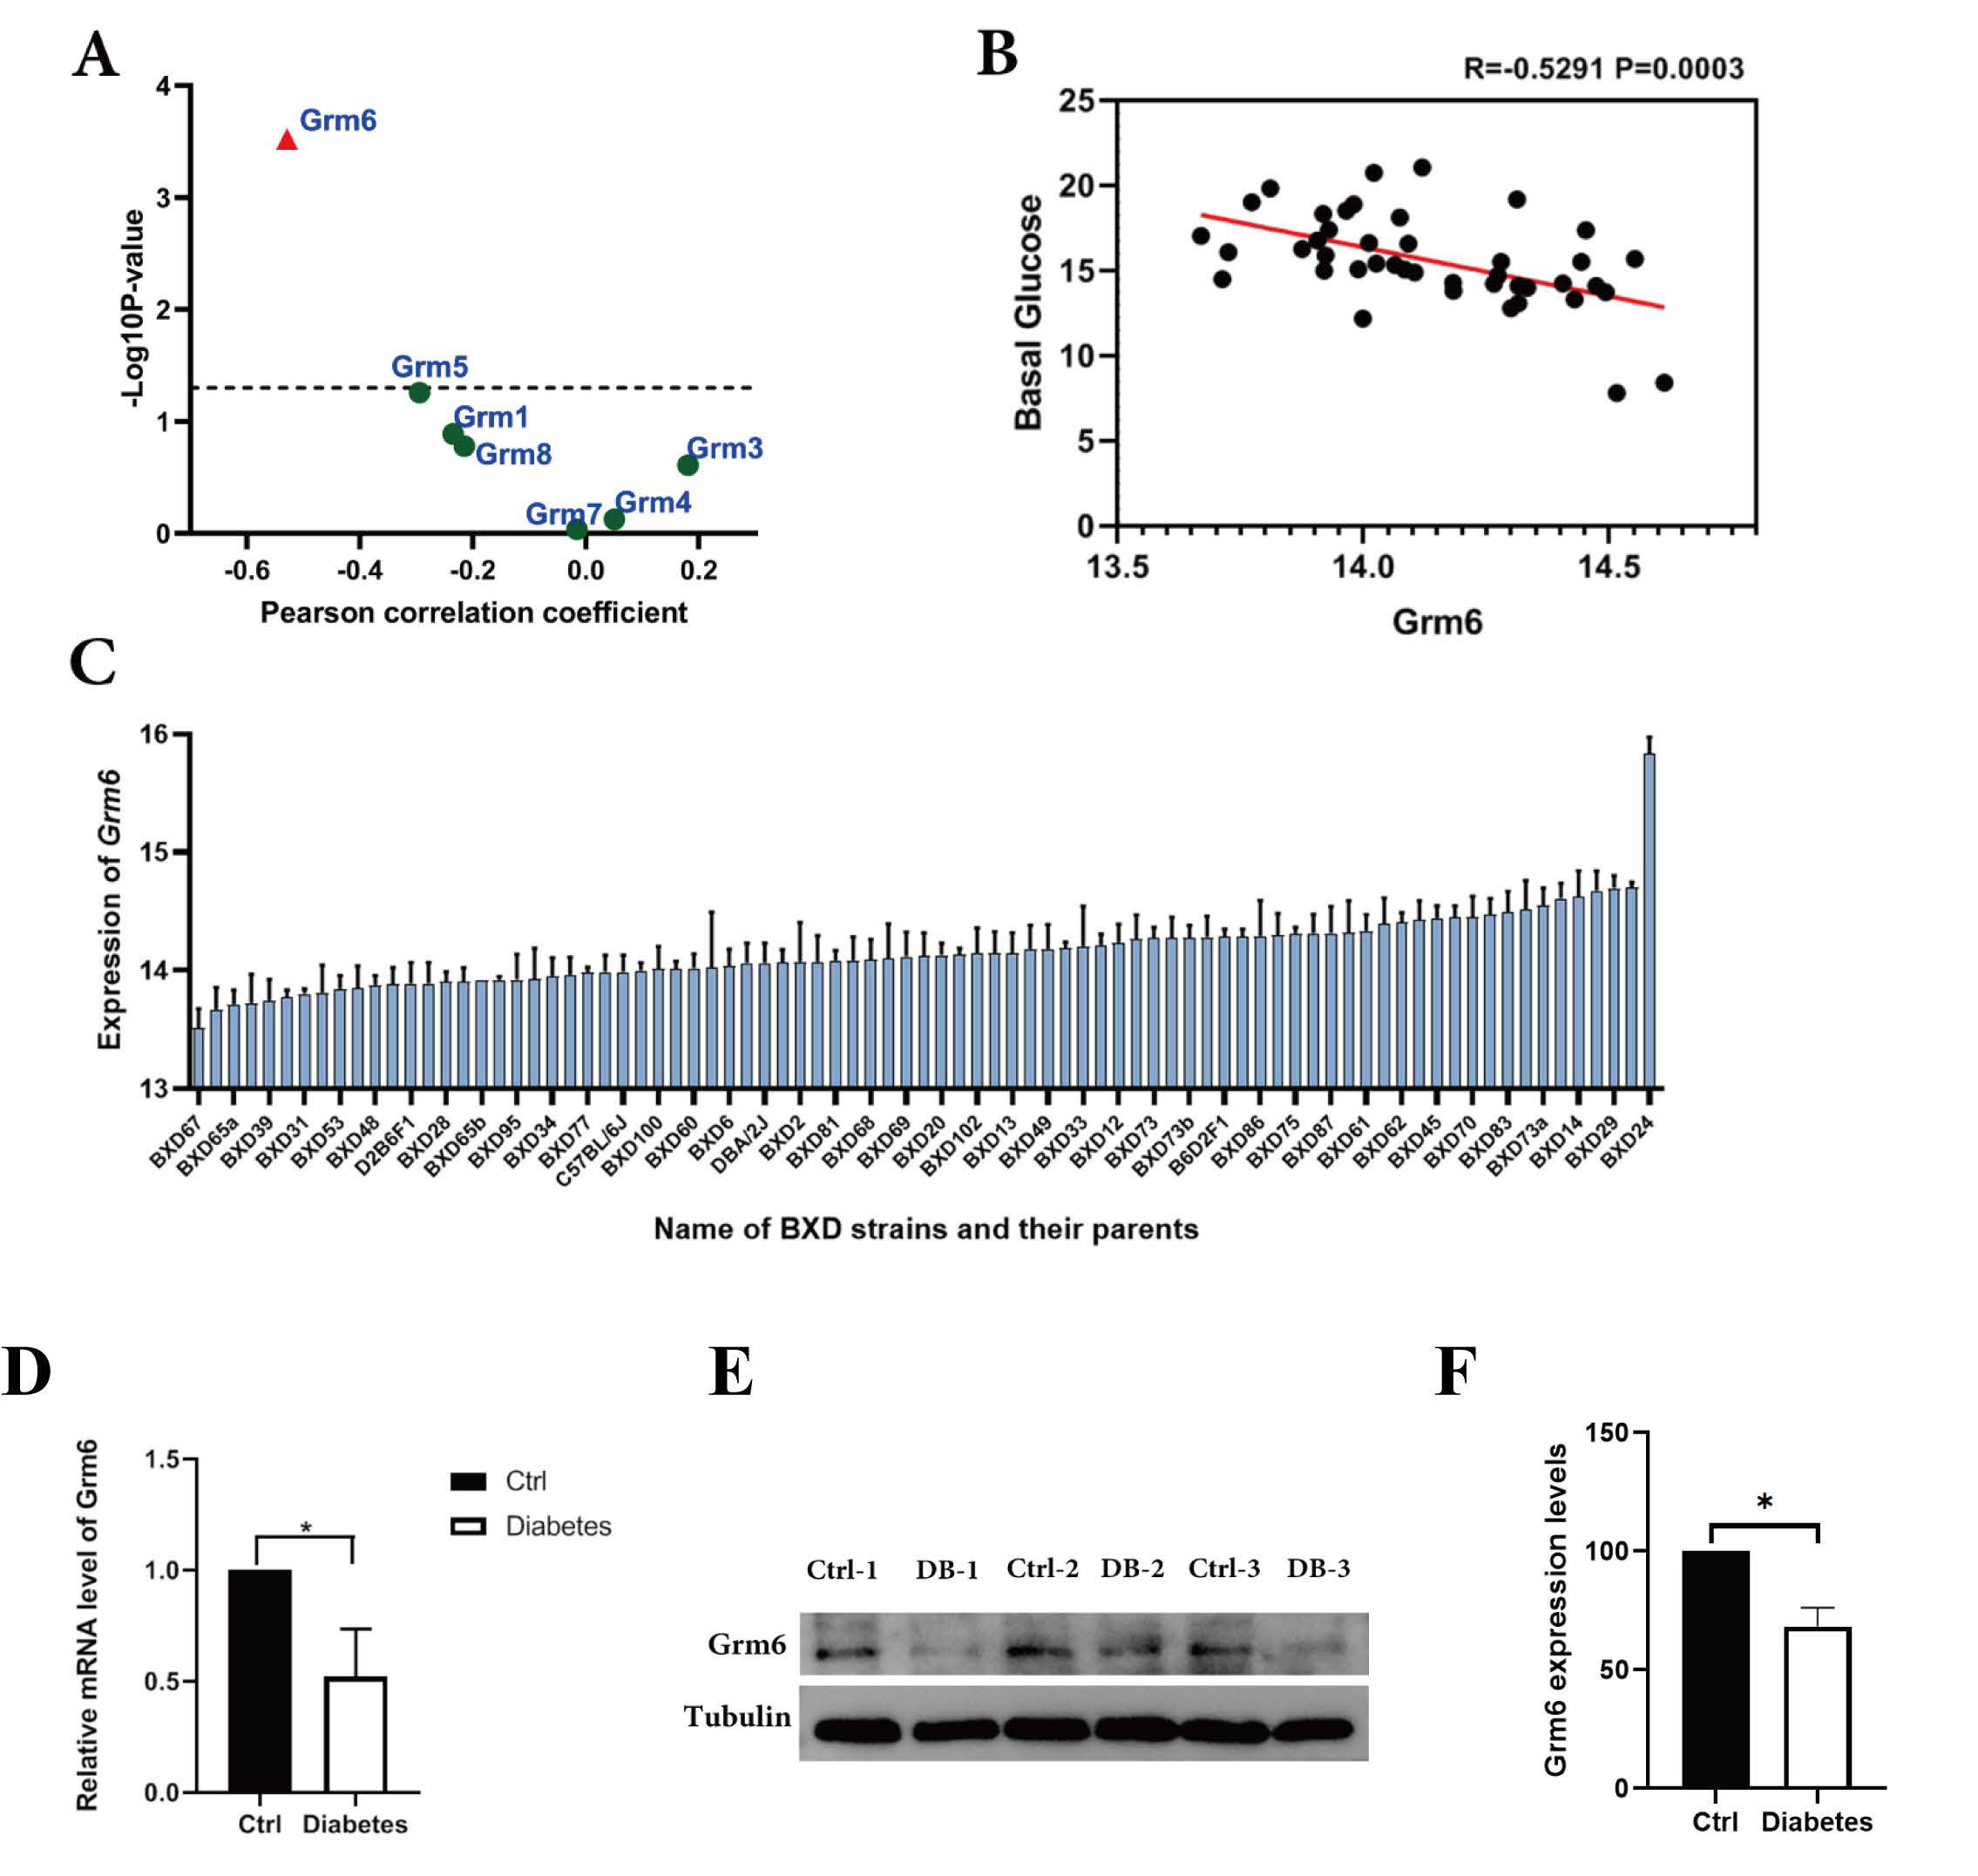
 Figure 4 of
Lian, Mol Vis 2025; 31:440-452.
Figure 4 of
Lian, Mol Vis 2025; 31:440-452.