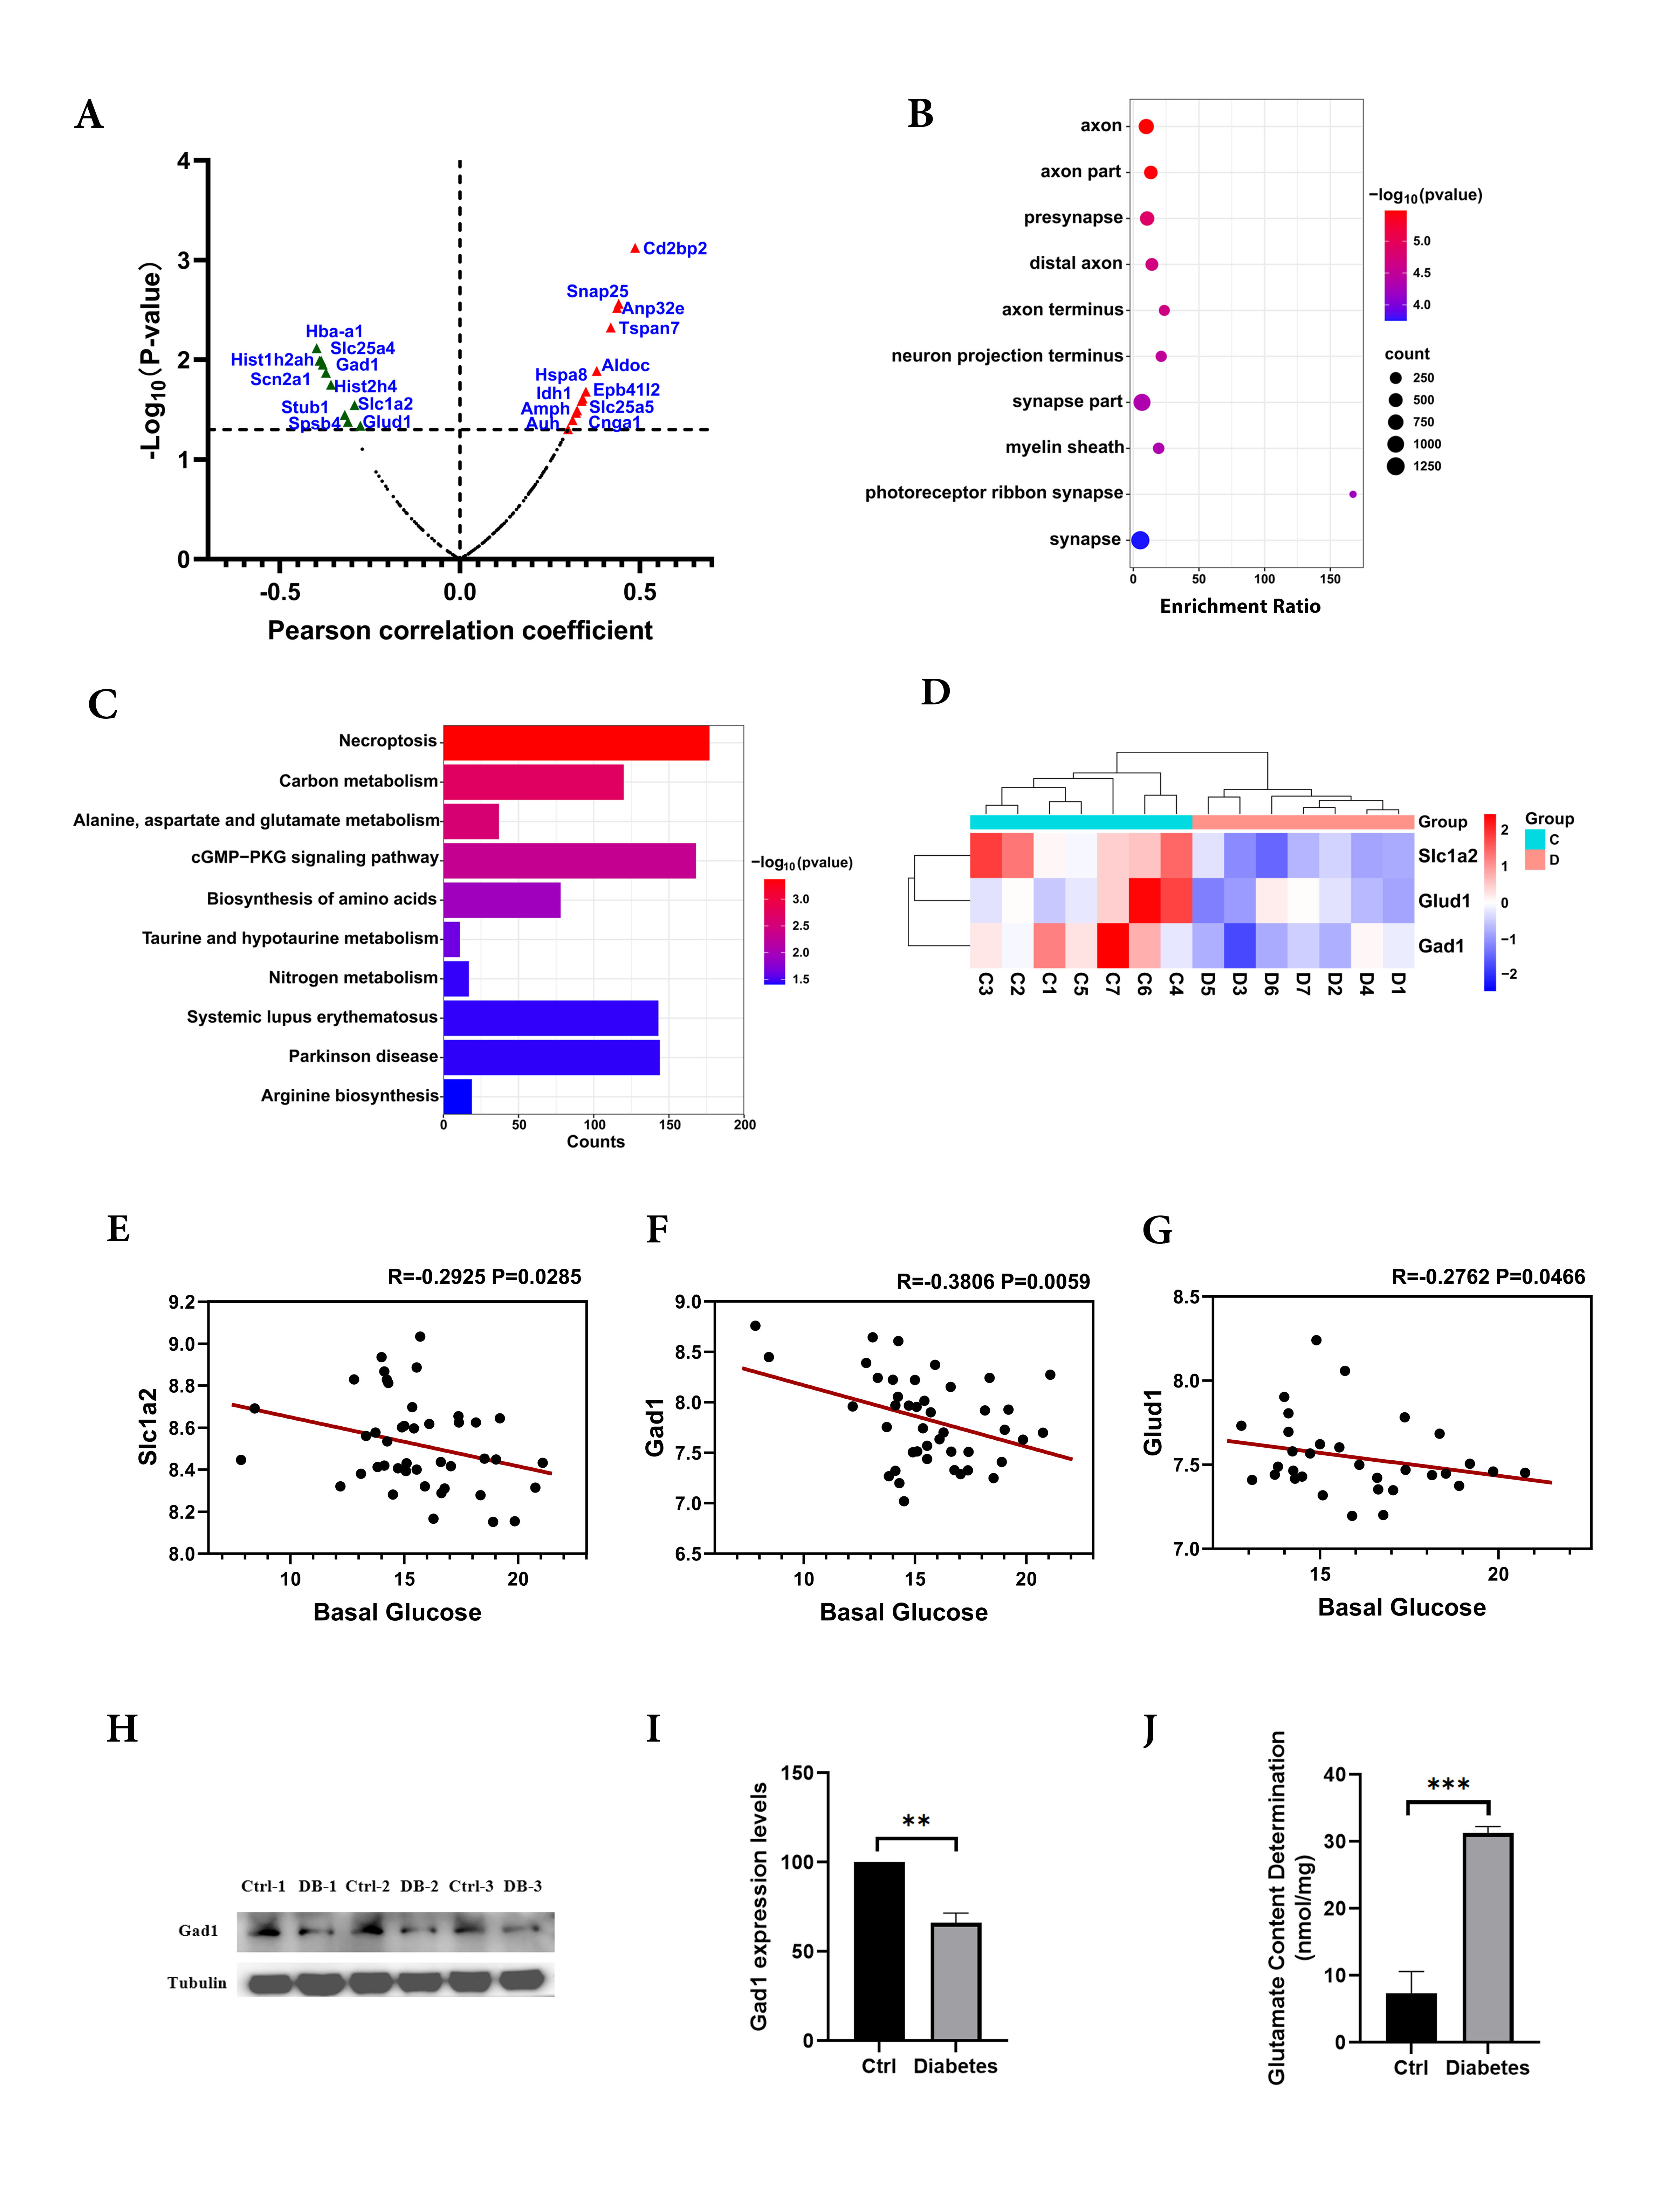
Figure 3. Hyperglycemia leads to aberrant glutamate metabolism.
A: The correlations between retinal mRNA levels of differentially expressed proteins and the blood glucose level from BXD mice
(Record ID17799) were evaluated, and 22 genes were significantly associated with the blood glucose level. The red triangles
represent significant positive associations, the green triangles represent significant negative associations, and the dark
plots represent no statistical significance.
B: Gene Ontology analysis based on their Cellular Component (CC). The 22 genes were enriched in axon, axon part, and presynaptic.
The size of the dots represents the number of genes, and the color indicates the p values.
C: Kyoto Encyclopedia of Genes and Genomes pathway analysis shows that the top three enriched pathways included alanine, aspartate,
and glutamate metabolism. The color represents the p values (
WebGelstat).
D: Three proteins (Slc1a2, Gad1 and Glud1) involved in glutamate metabolism, which were downregulated in the diabetic retina,
are shown by a heatmap. The red indicates upregulated proteins, while blue represents downregulated proteins. C, control group;
D, diabetes group.
E–G: The scatterplots illustrate the correlations between blood glucose levels and the expression of three glutamate catabolism–related
genes, including
slc1a2 (
E),
gad1 (
F), and
glud1 (
G). The
R and p values are shown in the figure. The gene expression data were log
2-transformed in this analysis.
H–I: western blot analysis shows that Gad1 protein expression was decreased in the diabetic mouse retina.
J: The glutamate content in the mouse retina was measured using an enzyme-linked immunosorbent assay kit.
 Figure 3 of
Lian, Mol Vis 2025; 31:440-452.
Figure 3 of
Lian, Mol Vis 2025; 31:440-452.