Figure 1. The diabetic mouse model shows impaired scotopic vision. A: The mice with diabetes for a month had higher random blood glucose levels than controls. n=10, ****p<0.0001. B–D: The representative electroretinographic statistical analysis in normal mice and diabetic mice shows that the amplitudes
of the a- and b-waves in diabetic mice significantly decreased. n=6 eyes in each group. Data are shown as mean ± SD **p<0.01.
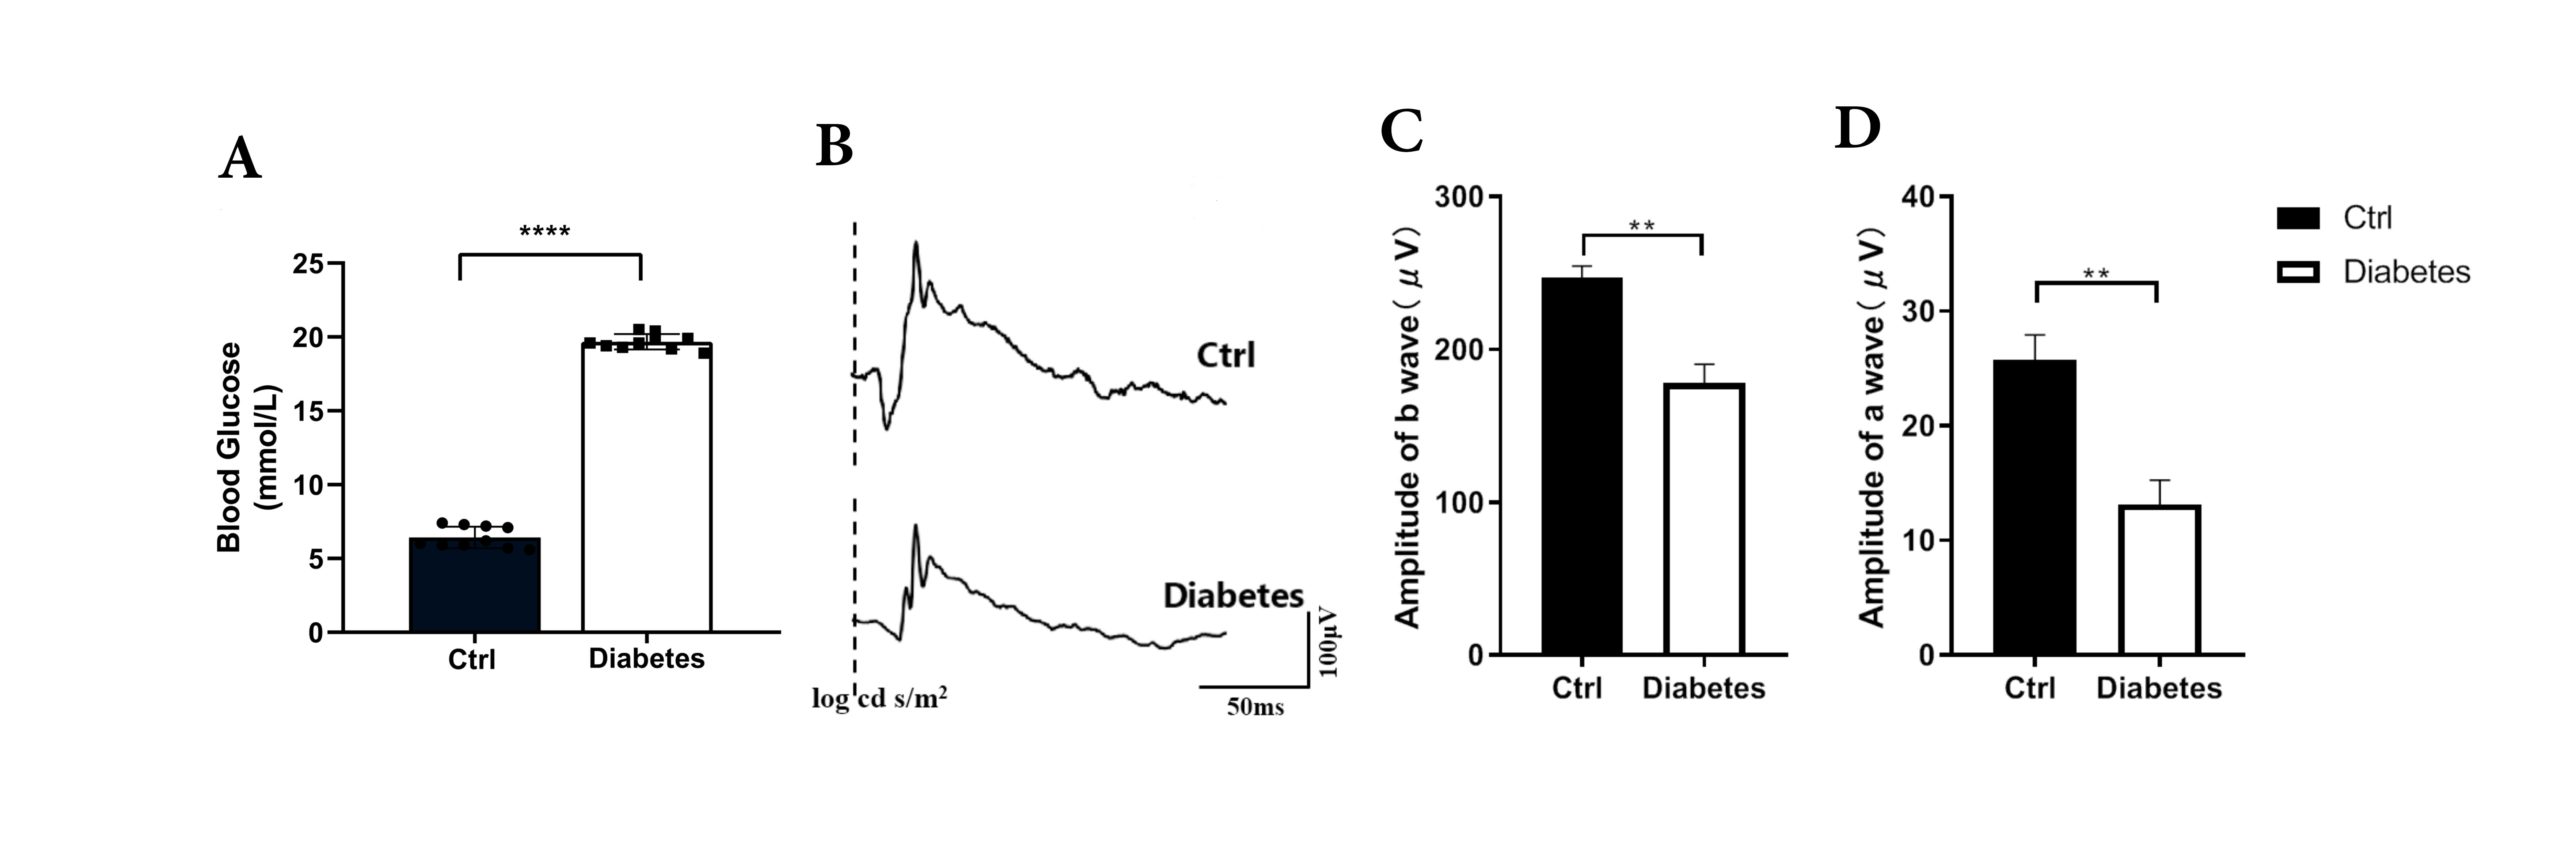
 Figure 1 of
Lian, Mol Vis 2025; 31:440-452.
Figure 1 of
Lian, Mol Vis 2025; 31:440-452.